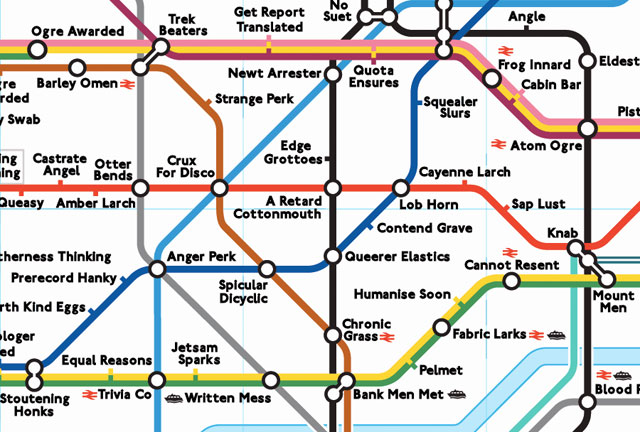
Anagram map of the London Underground
Otter Bends, Queer Spank, Frog Innard, and Lob Horn are some of the stations on the anagram map of the London Underground.
This site is made possible by member support. 💞
Big thanks to Arcustech for hosting the site and offering amazing tech support.
When you buy through links on kottke.org, I may earn an affiliate commission. Thanks for supporting the site!
kottke.org. home of fine hypertext products since 1998.
Beloved by 86.47% of the web.
Otter Bends, Queer Spank, Frog Innard, and Lob Horn are some of the stations on the anagram map of the London Underground.
Smithsonian.com has a neat interactive map that shows how the Battle of Gettysburg played out in the Civil War. For best results, do one run through zoomed out a little and then another run-through to at a closer zoom level to see the details. (via digg)
New prints in the Dorothy shop: these really cool Hollywood Star Charts, available in Golden Age and Modern Day editions.
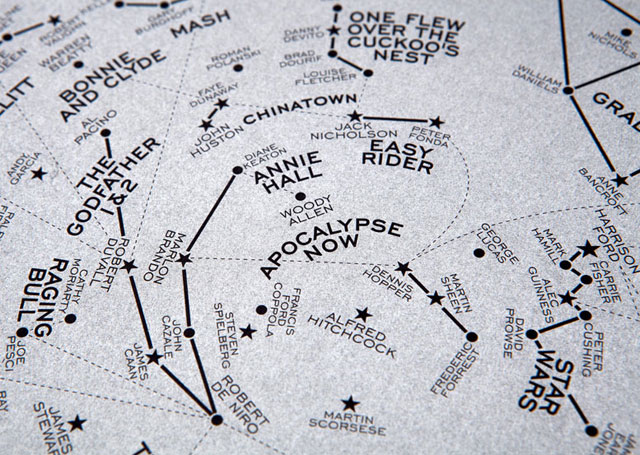
The Modern Day version of our Hollywood Star Chart features constellations named after some of the most culturally significant films to have appeared on the silver screen since 1960 - present day. The stars that make up the clusters are the Hollywood stars that appeared in them.
The chart is based on the night sky over New York on June 16th 1960 — the date of the first showing of Hitchcock’s ‘Psycho’ at the DeMille Theater. With its new approach to storytelling, characterisation and violence it is seen as a key movie in the start of the post-classical era of Hollywood.
The 108 films featured include those chosen for preservation in the US National Film Registry due to their cultural, historical, or aesthetic significance; Academy Award winners; and a few personal favourites. Films include Easy Rider, Bonnie and Clyde, The Exorcist, The Godfather, Chinatown, Star Wars, Pulp Fiction and Avatar.
You may remember Dorothy from their movie name maps.
Perhaps inspired by All Streets, Ben Fry’s map of all the streets in the US, Nelson Minar built a US map out of all the rivers in the country.
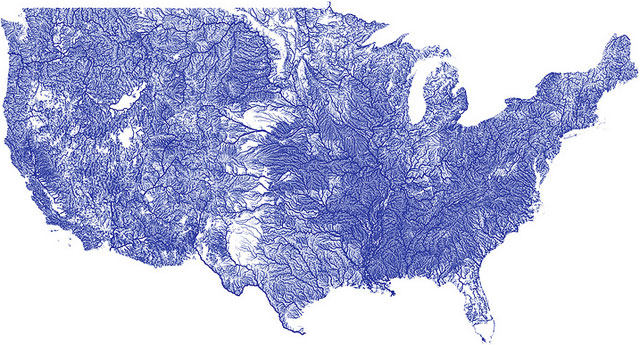
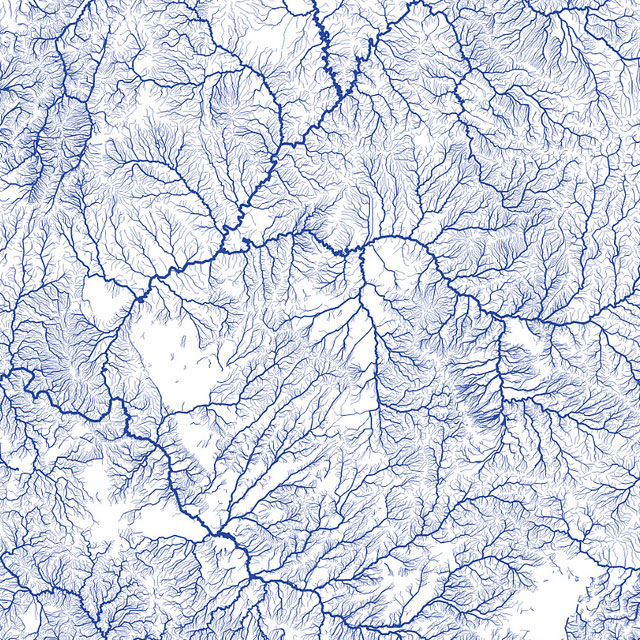
Minar put all the data and files he used up on Github so you can make your own version.
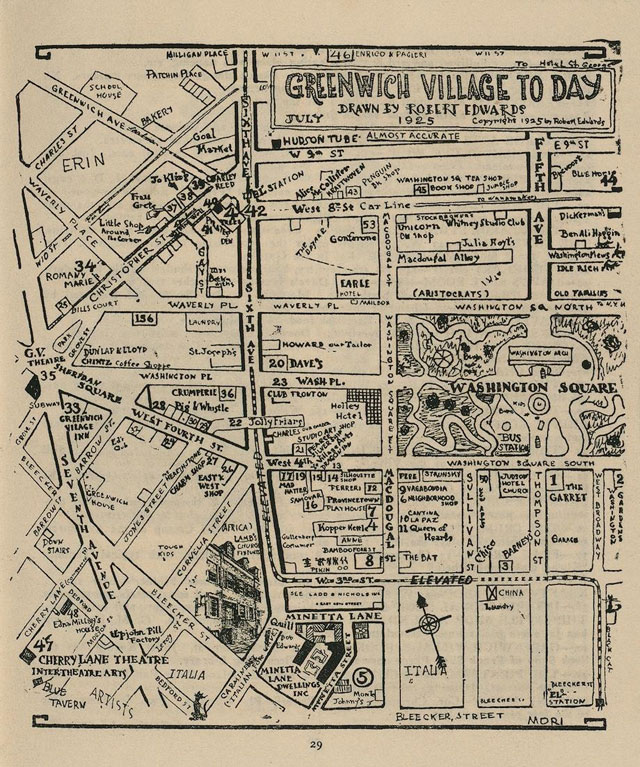
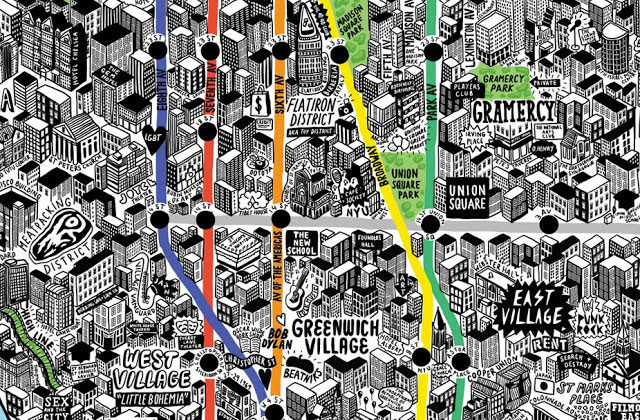
From a 1925 issue of Quill magazine, a map of NYC’s Greenwich Village hand-drawn by Robert Edwards.
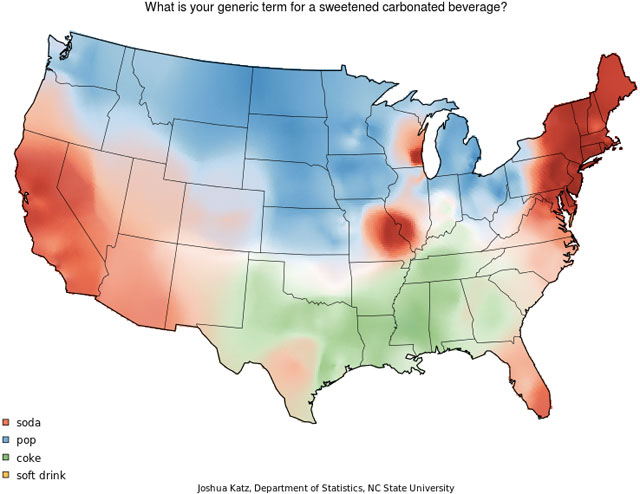
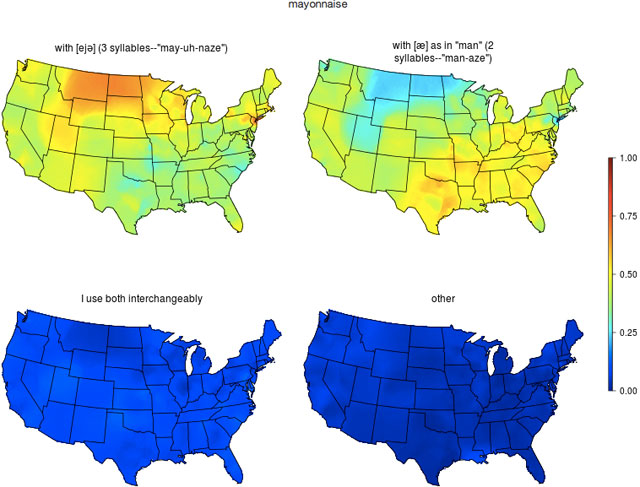
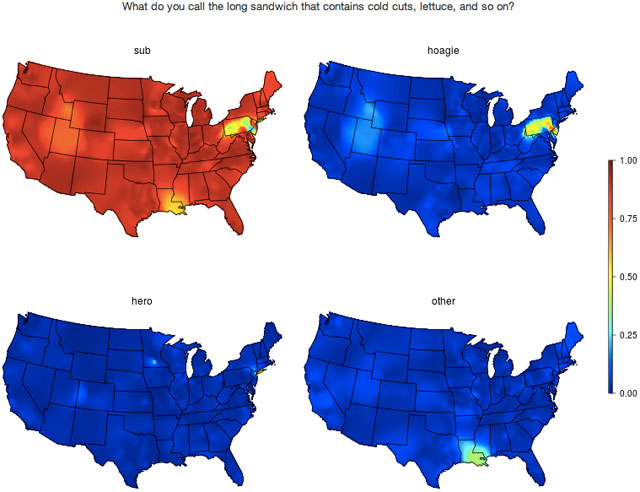
Joshua Katz has been studying American dialects and has made more than 120 maps of some of the differences in American speech. Here are a few examples:
(thx, everyone)
Update: As he notes on the site, Katz’s maps are based on the research and work of Bert Vaux…Vaux’s maps of the same data can be found here. (thx, molly, margaret, & nicholas)
MyReadingMapped makes use of Google Maps & Google Earth to tell stories about history. For instance, here are maps of The Civil War and the American Revolution, a map of Roald Amundsen’s 1910 South Pole expedition, and a map of the wars of Alexander the Great.
Working with the USGS, NASA, and Time, Google has built a viewer for satellite image time lapses. Among the images are those of the deforestation of the Amazon rainforest, the retreat of an Alaskan glacier, and the growth of Dubai. You can also refocus the map on any other area you want. More info here and here’s the extensive Time feature.
View the maps from the David Rumsey Historical Map Collection overlaid on their locations on Google Maps.
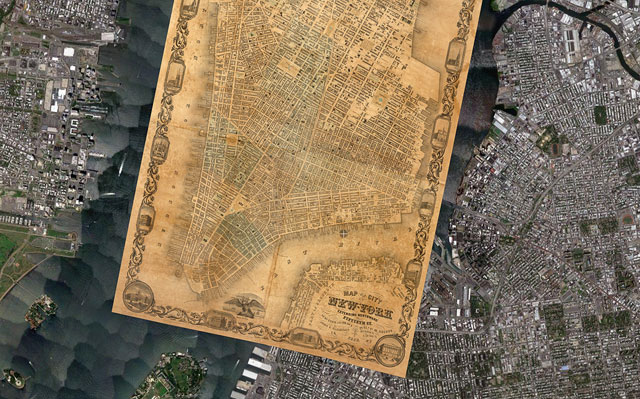
A great way to browse an incredible collection of maps. See also Google Earth Time Machine. (via @H_FJ)
The Morning News has a collection of maps showing the neighborhoods that New Yorkers might want to move to in a variety of cities around the world. Probably lots of generalizations to argue about here…have fun!
Prenzlauer Berg = Park Slope. Among the first neighborhoods to be gentrified after the Wall fell, Prenzlauer Berg (the locals shorten it to Prenzlberg, which isn’t all that much shorter, but whatever) is populated by the same desperately, tragically hip mothers and fathers as Park Slope. But American yuppies have nothing on their German counterparts, who will invade a coffee shop, block the door with strollers, and turn it into a temporary romper room.
XKCD has linked all the subway systems of North America into one map. That South Ferry to San Juan submarine line is a hike.
This looks beautiful: A Map of the World is a collection of maps by illustrators and storytellers. I’ve featured at least a few of the maps in the book here on kottke.org. Here’s a sample:
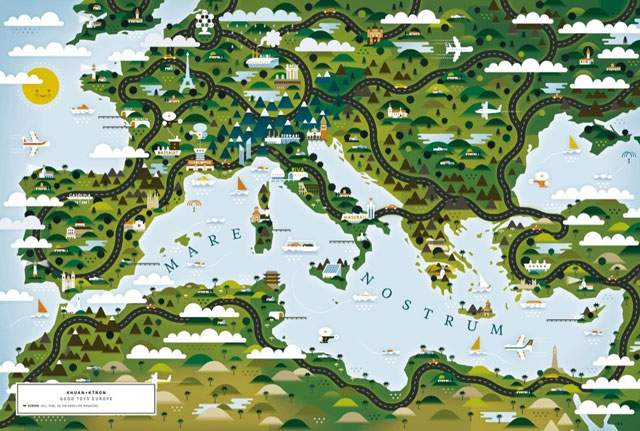
You can see more of the maps in the book on the publisher’s web site. (via raul, who says “This book is insanely beautiful. Buy it if you love maps. It will make you happy.”)
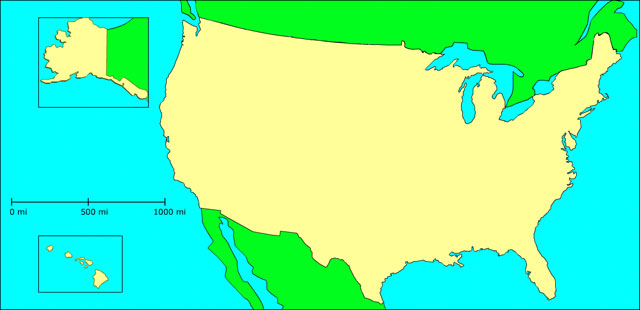
As part of a thought experiment to reform the electoral college, Neil Freeman redrew the US into 50 new states with equal population. In trying to balance the interests of the popular vote vs the integrity of states, he’s split the baby so that no one is likely to be happy. Perfect!

The map began with an algorithm that groups counties based on proximity, urban area, and commuting patterns. The algorithm was seeded with the fifty largest cities. After that, manual changes took into account compact shapes, equal populations, metro areas divided by state lines, and drainage basins. In certain areas, divisions are based on census tract lines.
Keep in mind that this is an art project, not a serious proposal, so take it easy with the emails about the sacred soil of Texas.
(via ★doingitwrong)
There’s not much to say about these gorgeous, wooden, laser-cut bathymetric charts of various bodies of water except that just look at them!
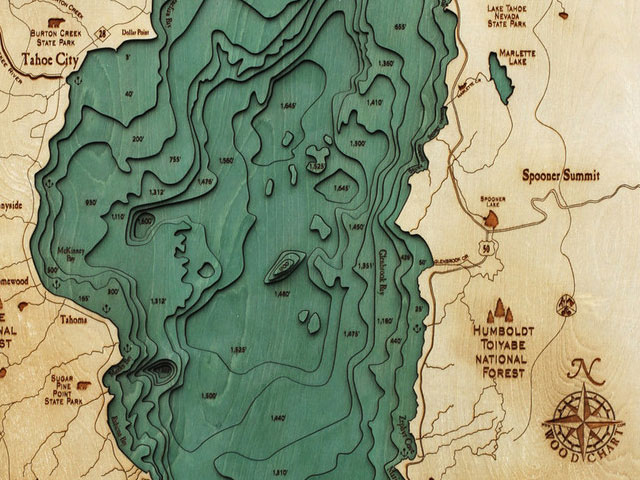
(thx, mouser)
Your Apple Maps nightmare is over. Google has (finally!) released an iOS app for Google Maps.
A group of Australian scientists sailing to research plate tectonics discovered more than they were expecting. Well, less. They sailed right through where an island should have been.
Dr. Maria Seton, our cheif scientist, noticed that on the path that we were taking there was this very unusal island. Essentially it was on all the Google Earth maps and it was on all the weather charts. But when you zoom in on it it was just a black blob. Google had no photos from it. It was just this sort of slit in the Earth.
(via ★interesting-links)
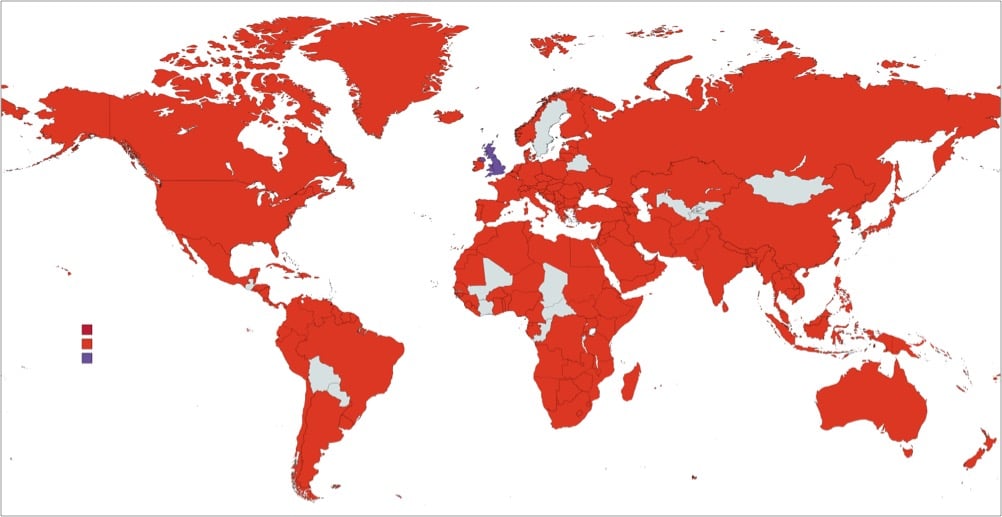
Of the current 200 nations in the world, the British have invaded all but 22 of them. The lucky 22 include Sweden, Luxembourg, Mongolia, Bolivia, and Belarus. The full analysis is available in Stuart Laycock’s book, All the Countries We’ve Ever Invaded.
Stuart Laycock, the author, has worked his way around the globe, through each country alphabetically, researching its history to establish whether, at any point, they have experienced an incursion by Britain.
Only a comparatively small proportion of the total in Mr Laycock’s list of invaded states actually formed an official part of the empire.
The remainder have been included because the British were found to have achieved some sort of military presence in the territory — however transitory — either through force, the threat of force, negotiation or payment.
Incursions by British pirates, privateers or armed explorers have also been included, provided they were operating with the approval of their government.
The US currently has military personnel stationed in all but 43 countries.
For instance, as of Sept. 30, 2011, there were 53,766 military personnel in Germany, 39,222 in Japan, 10,801 in Italy and 9,382 in the United Kingdom. That makes sense. But wait, scanning the list, you also see nine troops in Mali, eight in Barbados, seven in Laos, six in Lithuania, five in Lebanon, four in Moldova, three in Mongolia, two in Suriname and one in Gabon.
But the presence in most of those countries is due to diplomatic usage of military personnel. (thx, aaron)
The Blaze has a collection of county-by-county election maps for every US Presidential election since 1900.
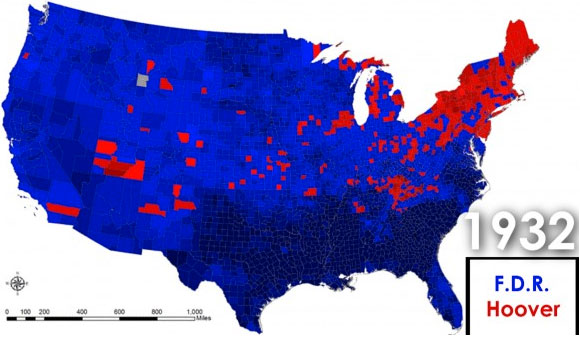
The video at the bottom is worth watching to witness the shift between a north/south divided country to a urban/rural divided country over the past 20 years.
Starting with a blank map of the US, the object is to place each state in its proper place.
My average error was 8 miles. A better test would be to start each state with the blank map…placing Colorado in the western part of the country without any guide is much tougher than doing it last. (via @notrobwalker)
This is a time lapse world map showing all the battles that have occurred in the past 1000 years. Worth sitting through the whole thing to see Europe go absolutely bonkers in the late 1930s.
(via @DavidGrann)
There’s not a whole not more to this radio than what it looks like, but I will forever have a soft spot for things that mimic the London tube map.

Now, if it contained vacuum tubes or something…
The Atlantic’s Alexis Madrigal gets an inside look at how Google builds its maps (and what that means for the future of everything). “If Google’s mission is to organize all the world’s information, the most important challenge — far larger than indexing the web — is to take the world’s physical information and make it accessible and useful.”
Once again, here’s the link to the maps that show which NFL games will be shown in which parts of the country.
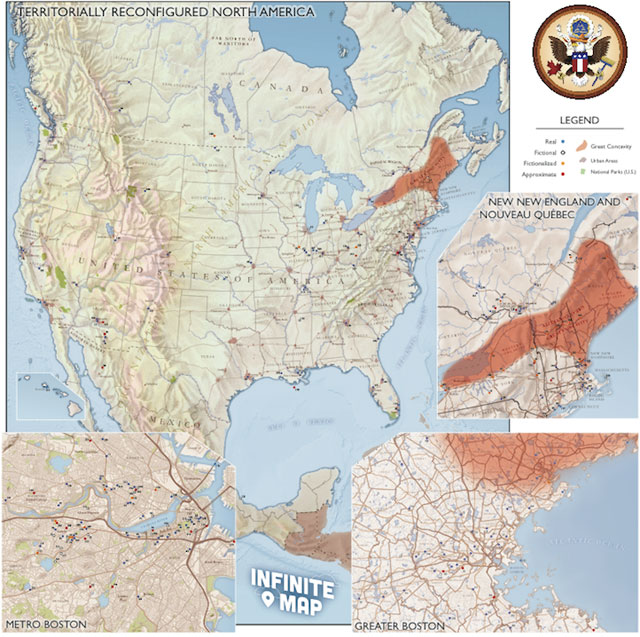
In July, we mentioned Infinite Boston, a project from William Beutler to map and photo the Boston-related locations in Infinite Jest. Today Beutler announced Infinite Atlas, which expands nationally on this project, and Infinite Map, a limited edition print featuring 250 “of the most interesting locations” from Infinite Jest.
Paul Bourke has collected a bunch of images from Google Earth of natural features that display fractal patterns. This one, from Egypt, is flat-out amazing:
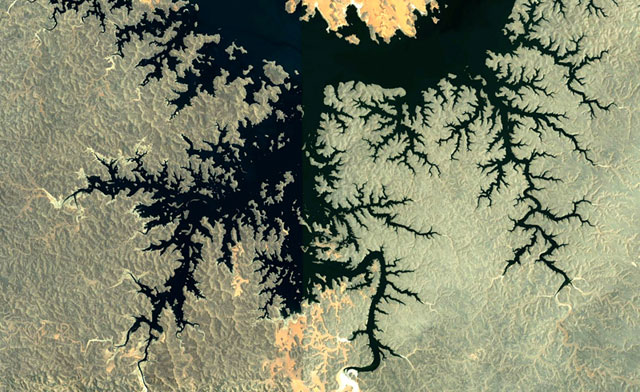
(via ★interesting)
The Google Earth Time Machine blog uses Google’s historical satellite maps to make now-and-then comparisons of interesting places around the world. Like the transformation of this Texas river bend into an oxbow lake over 60+ years:
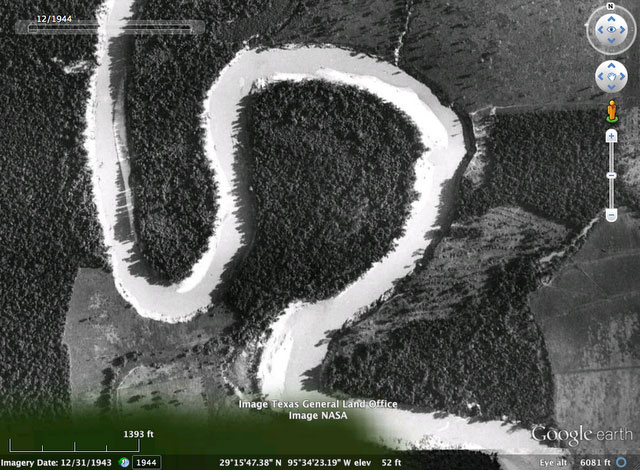
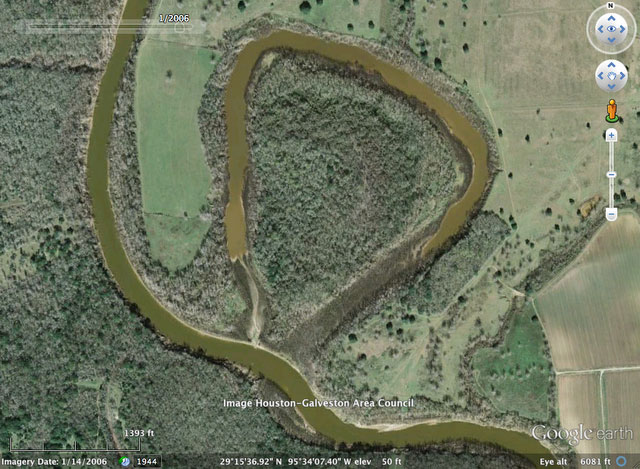
(via stellar)
Design firm Dorothy has created a map where all the features are movie-themed: Jurassic Park, Shutter Island, Howards End, the Soylent Green…that sort of thing.
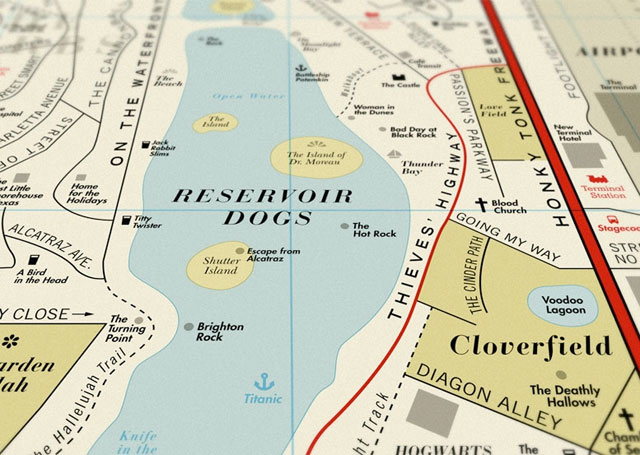
See also their song map.
If you’ve ever wondered if any Major League Baseball players come from your favorite city, this is the map for you. See also the 2011-2012 NHL Player map. The maps are by Mike Morton, and I’m fascinated by the fact the NHL had players from both Africa and Brazil, while MLB did not. (via @jonahkeri)
The Atlas of the United States Printed for the Use of the Blind, published in 1837 before Braille was widely used, used embossed printing of lines, words, and symbols to be finger-readable.
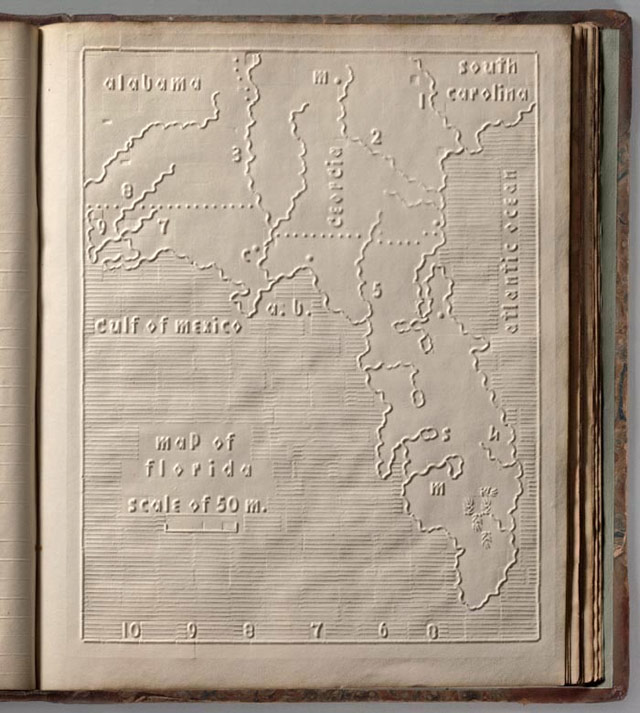
Without a drop of ink in the book, the text and maps in this extraordinary atlas were embossed heavy paper with letters, lines, and symbols. To the best of our knowledge, this is the first atlas produced for the blind to read without the assistance of a sighted person. Braille was invented by 1825, but was not widely used until later. It represented letters well, but could not represent shapes and cartographic features.
(via @ftrain)
Socials & More