All of the Rivers
Perhaps inspired by All Streets, Ben Fry’s map of all the streets in the US, Nelson Minar built a US map out of all the rivers in the country.


Minar put all the data and files he used up on Github so you can make your own version.


This site is made possible by member support. 💞
Big thanks to Arcustech for hosting the site and offering amazing tech support.
When you buy through links on kottke.org, I may earn an affiliate commission. Thanks for supporting the site!
kottke.org. home of fine hypertext products since 1998.
Perhaps inspired by All Streets, Ben Fry’s map of all the streets in the US, Nelson Minar built a US map out of all the rivers in the country.


Minar put all the data and files he used up on Github so you can make your own version.

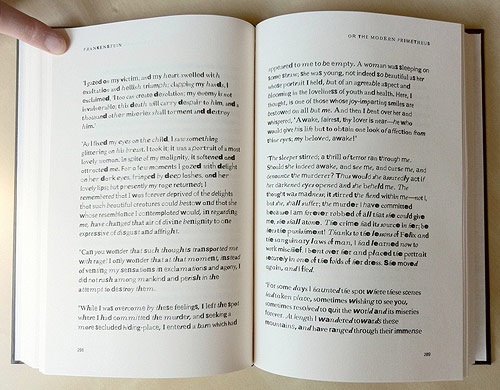
From Fathom, a copy of Mary Shelley’s Frankenstein constructed from found type on the web…as the book goes on, the type gets less legible.
The incomplete fonts found in the PDFs were reassembled into the text of Frankenstein based on their frequency of use. The most common characters are employed at the beginning of the book, and the text devolves into less common, more grotesque shapes and forms toward the end.
Ben Fry just updated his interactive salary vs performance graph that compares the payrolls of major league teams to their records. Look at those overachieving Rays and Marlins! And those underachieving Indians, Mets, and Cubs!
Johannes Kreidler took the data from recent stock charts, fed it to Microsoft Songsmith, and produced melancholy tunes. It’s like the Visualizer in iTunes, only backwards. Ben Fry says of the project:
My opinion of Songsmith is shifting — while it’s generally presented as a laughingstock, catastrophic failure, or if nothing else, a complete embarrassment (especially for its developers slash infomercial actors), it’s really caught the imagination of a lot of people who are creating new things, even if all of them subvert the original intent of the project. (Where the original intent was to… create a tool that would help write a jingle for glow in the dark towels?)
Ben Fry analyzes the data from an intelligence test administered to all incoming NFL players and displays the results by position. Offensive players do better than defensive players on the test, although running backs score the lowest (wide receivers and cornerbacks also don’t do well). As Michael Lewis suggested in The Blind Side, offensive tackles are the smartest players on the field, followed by the centers and then the quarterbacks.
Malcolm Gladwell talked about the Wonderlic test at the New Yorker Conference and judged it a poor indicator of future performance.
(Today is Ben Fry day on kottke.org. Apparently.) All Streets is a map of the US with all 26 million roads displayed on it. The best part is that features like mountains and rivers emerge naturally from the road system.
No other features (such as outlines or geographic features) have been added to this image, however they emerge as roads avoid mountains, and sparse areas convey low population. The pace of progress is seen in the midwest where suburban areas are punctuated by square blocks of area that are still farm land.
Here are a few technical details of how the map was made.
Ben Fry has updated his salary vs. performance chart for the 2008 MLB season that compares team payrolls with winning percentage. The entire payroll of the Florida Marlins appears to be less than what Jason Giambi and A-Rod *each* made last year.
Casey Reas and Ben Fry, inventors of the Processing programming language (that’s Proce55ing to you old schoolers), have just come out with a book on the topic that looks fantastic. In addition to programming tutorials are essays and interviews with other heavy hitters in the programmatic arts like Golan Levin, Alex Galloway, Auriea Harvey, and Jared Tarbell. The site for the book features a table of contents, sample chapters, and every single code example in the book, freely available for download. Amazon’s got the book but they’re saying it’s 4-6 weeks for delivery so I suggest hoofing it over to your local bookstore for a look-see instead.
Ben Fry has updated his salary vs. performance graph for the 2007 MLB season…it plots team payrolls vs. winning percentage. The Mets and Red Sox should be winning and are…the Yankees, not so much. Cleveland and the Brewers are making good use of their relatively low payrolls.
Stay Connected