Features of Adulthood
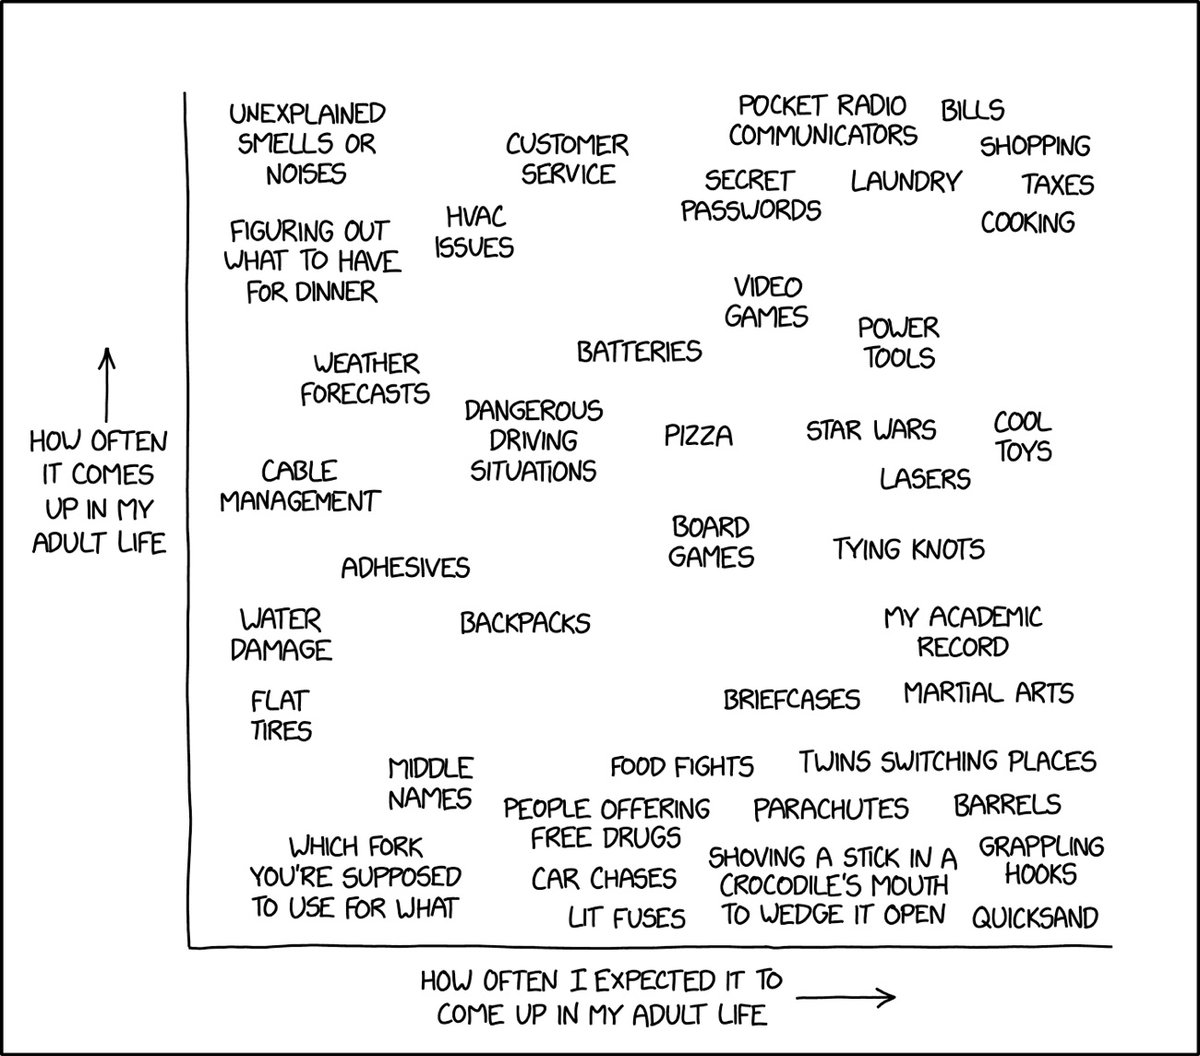
I enjoyed Randall Munroe’s take on what he thought adult life would be like as a kid…in the form of a graph, naturally. All those Looney Tunes reruns & 80s movies led us Gen Xers astray.


This site is made possible by member support. 💞
Big thanks to Arcustech for hosting the site and offering amazing tech support.
When you buy through links on kottke.org, I may earn an affiliate commission. Thanks for supporting the site!
kottke.org. home of fine hypertext products since 1998.

I enjoyed Randall Munroe’s take on what he thought adult life would be like as a kid…in the form of a graph, naturally. All those Looney Tunes reruns & 80s movies led us Gen Xers astray.
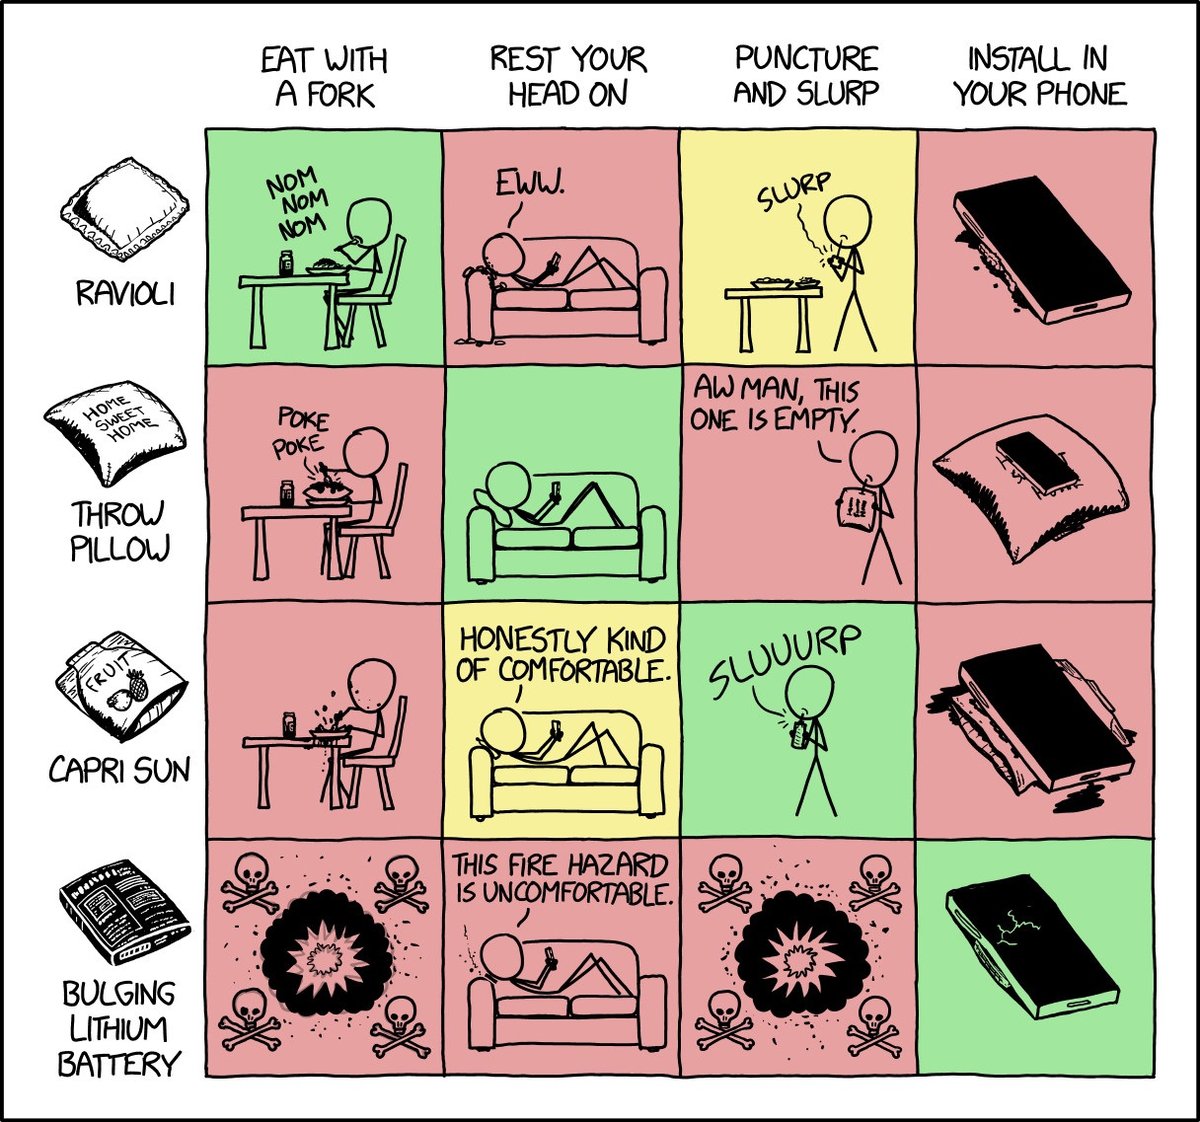
From XKCD: Ravioli-Shaped Objects. See also The Cube Rule of Food, the Grand Unified Theory of Food Identification.
From XKCD, a public safety announcement about driving: random drivers can’t grant you the right of way as a gift.
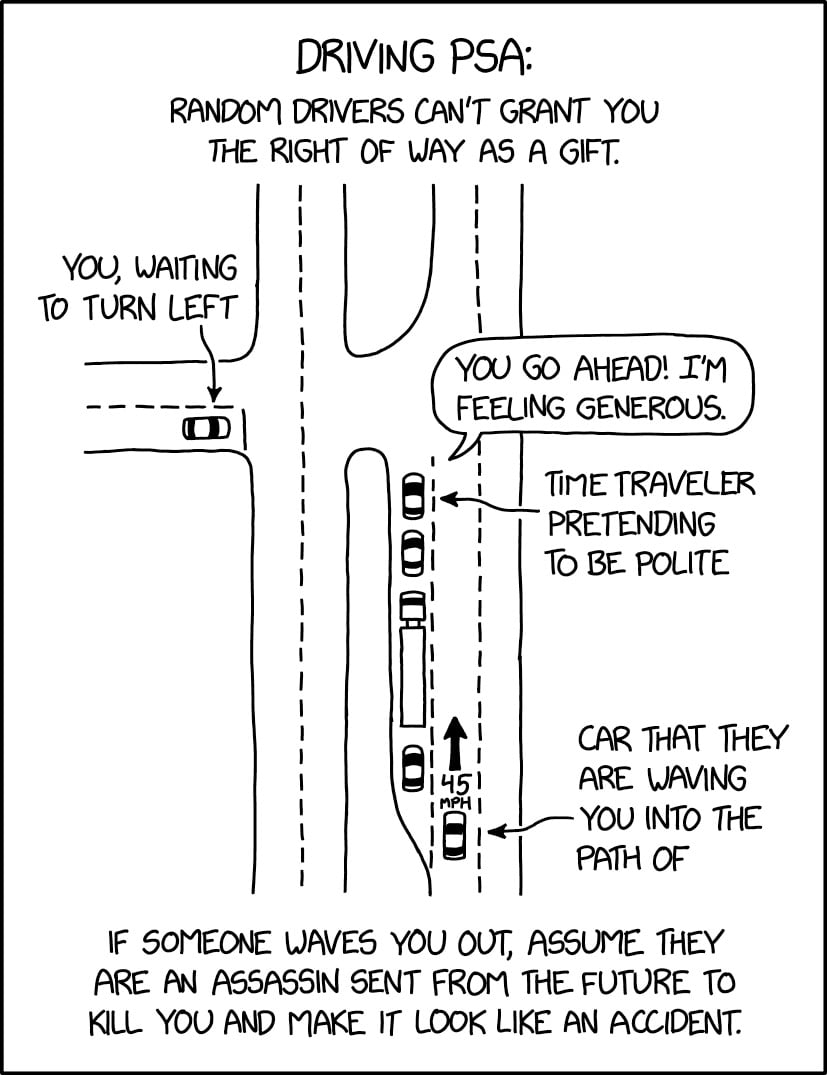
Yes, yes, yes, yes to the moon and back. I thought no one else noticed this! Vermont drivers are unusually “nice” in this regard and it drives me bonkers.
I was just explaining this to my son, a new driver, a couple of months ago. There’s a left turn at a one-way stop onto a busy road near my house that I do several times a week that is partially blind to oncoming traffic and you’ve really gotta commit when you do pull out because everyone’s doing 5-7+ mph over the limit coming around the curve. So, you end up sitting there for a bit and drivers coming from your right who are going to turn left in next to you will often see this and try to wave you through before they turn.
But you can’t grant right of way like that! I can’t trust that they’ve checked if oncoming traffic is ok and that no one is trying to sneak around them on the right into the lane I’m supposed to be turning into (something that happens frequently at this intersection, and at speed). (There are also bikes and pedestrians to keep track of.) All this presumably nice gesture does is make the situation more dangerous for me because I now feel socially obligated to accept their favor and time pressure to be quick about it. But instead I decline and insistently wave them through, the other driver possibly now offended at having their good deed refused and thinking I’m the asshole.
Just take the right of way when it’s yours and cede it when it’s not. That’s it — keep it predictable. That’s like 95% of driving right there.
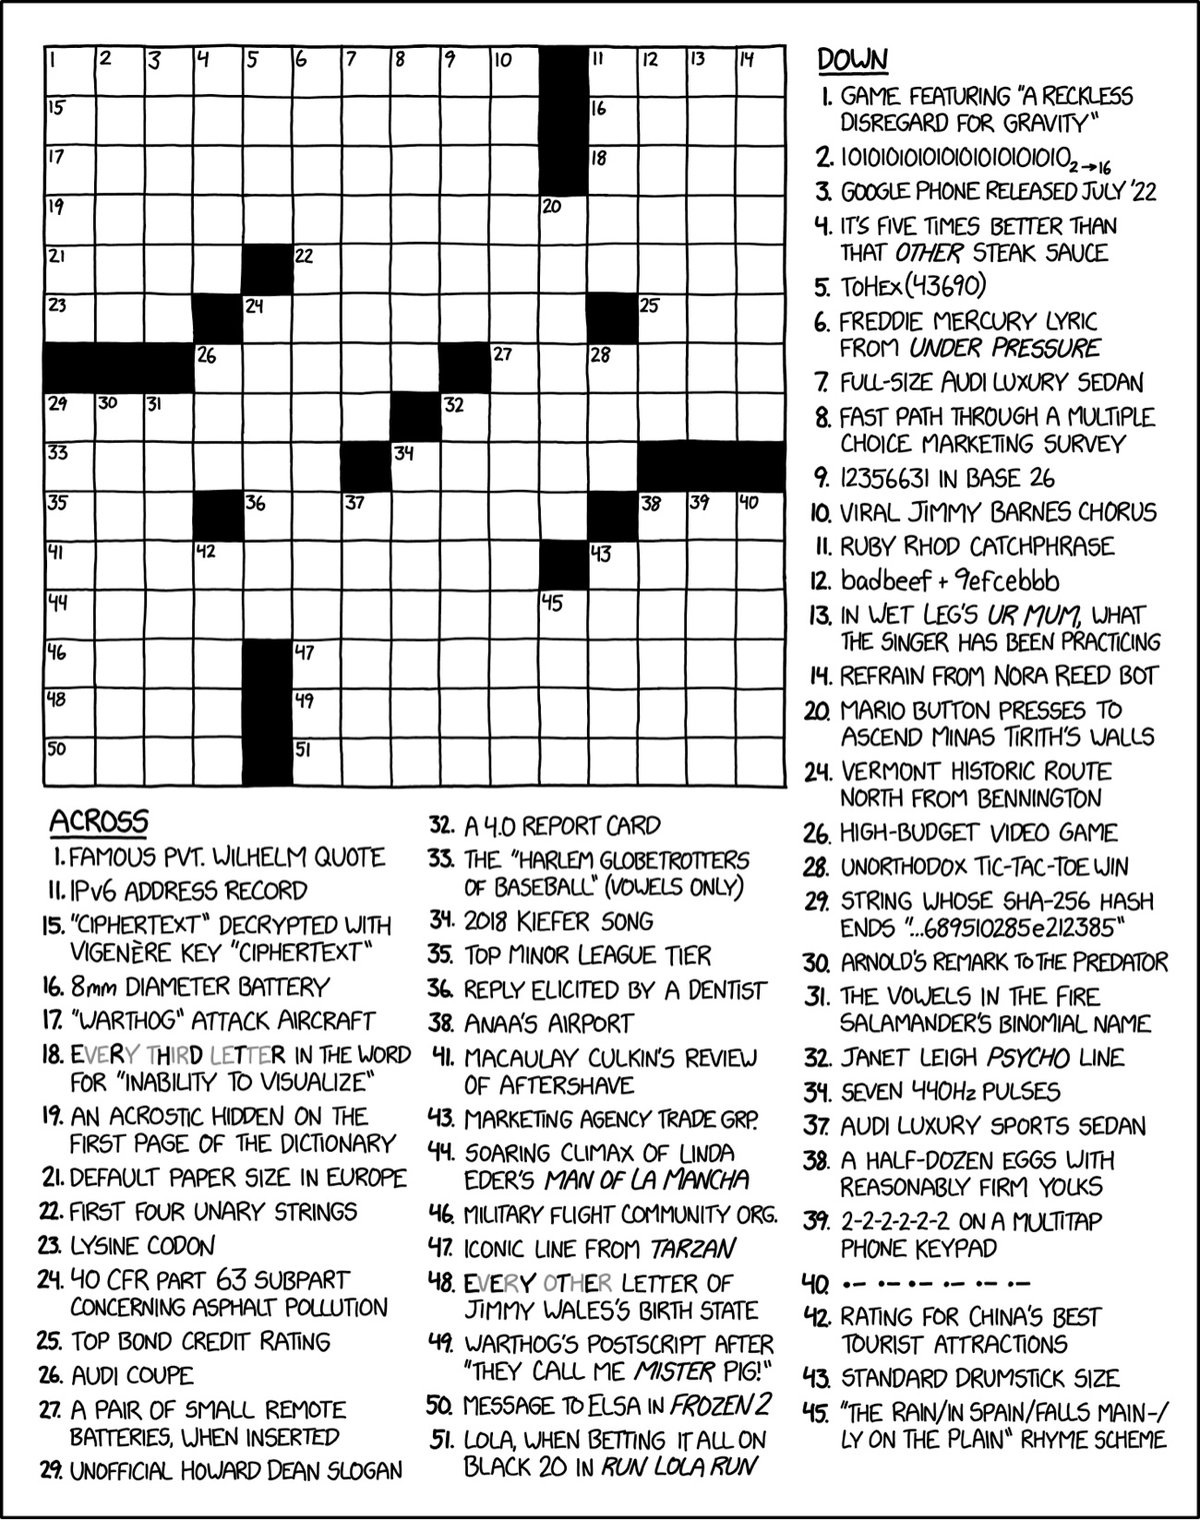
Although I am slightly disappointed this isn’t a “real” crossword puzzle, I do admire Randall Munroe’s commitment to the bit. And then there’s the gray letters…
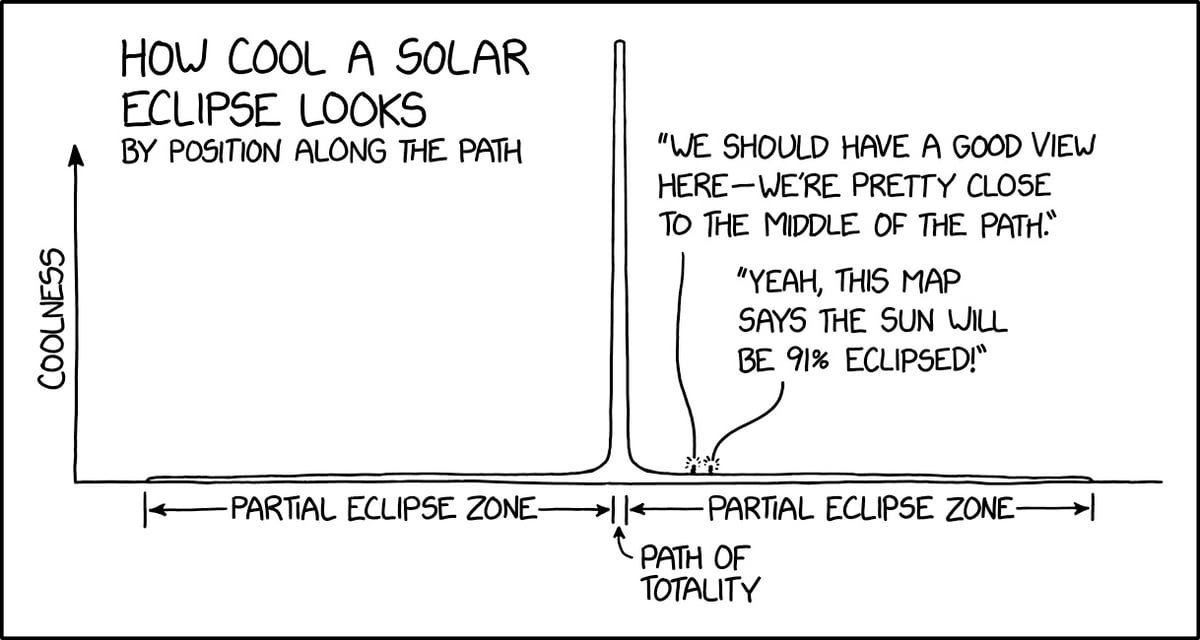
As usual, XKCD is spot on with this graph of solar eclipse coolness as a function of distance from the path of totality. The image’s alt text reads:
A partial eclipse is like a cool sunset. A total eclipse is like someone broke the sky.
See also the 2017 version. After witnessing the 2017 total solar eclipse, I wrote:
We saw the Baily’s beads and the diamond ring effect. And then…sorry, words are insufficient here. When the Moon finally slipped completely in front of the Sun and the sky went dark, I don’t even know how to describe it. The world stopped and time with it. During totality, Mouser took the photo at the top of the page. I’d seen photos like that before but had assumed that the beautifully wispy corona had been enhanced with filters in Photoshop. But no…that is actually what it looks like in the sky when viewing it with the naked eye (albeit smaller). Hands down, it was the most incredible natural event I’ve ever seen.
I’m not sure exactly what I expected, but this wasn’t it. I’d seen photos of coronas around suns, but this wasn’t that. And I’d expected that those photos, like many astronomical pictures, are long exposure, other wavelengths, and otherwise capturing things the naked eye can’t see. I thought there might be a glow of light in a circle, or nothing, or, I don’t know. What I did not expect was an unholy horror sucking the life and light and warmth out of the universe with long reaching arms, that what I’d seen in pictures was not an exaggeration but a failure to capture the extent of this thing that human eyes, and not cameras, are uniquely suited to absorb the horror of.
I had seen a partial eclipse in 1970. A partial eclipse is very interesting. It bears almost no relation to a total eclipse. Seeing a partial eclipse bears the same relation to seeing a total eclipse as kissing a man does to marrying him, or as flying in an airplane does to falling out of an airplane. Although the one experience precedes the other, it in no way prepares you for it.
I am so looking forward to Monday and crossing my fingers for clear skies — the path of totality goes right over my house.
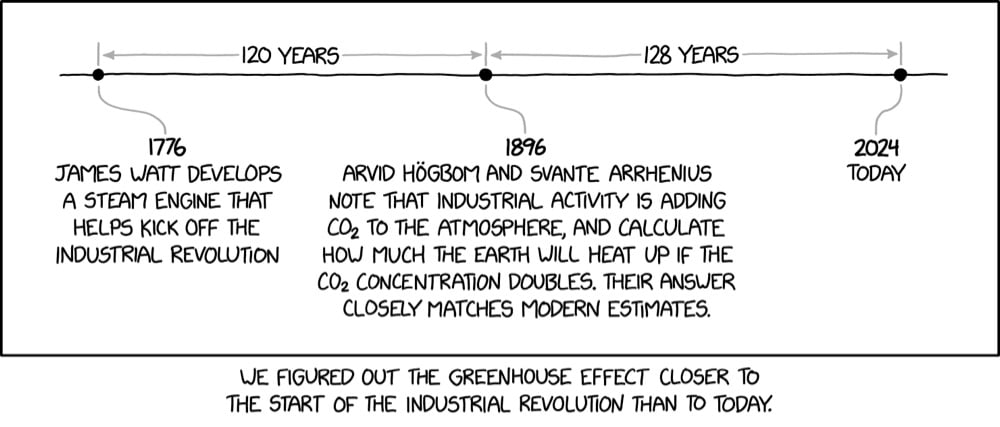
In 1896, scientists determined that industrialization was adding CO2 to the atmosphere and quantified how much it would warm the Earth. That date is closer to the start of the Industrial Revolution than to the present day.
If you’re wondering, like I did, about that 1896 date — what about Fourier and Pouillet and Tyndall and Eunice Foote? — the Wikipedia pages on the history of the discovery of the greenhouse effect and the history of climate change science are worth a read.
The warming effect of sunlight on different gases was examined in 1856 by Eunice Newton Foote, who described her experiments using glass tubes exposed to sunlight. The warming effect of the sun was greater for compressed air than for an evacuated tube and greater for moist air than dry air. “Thirdly, the highest effect of the sun’s rays I have found to be in carbonic acid gas.” (carbon dioxide) She continued: “An atmosphere of that gas would give to our earth a high temperature; and if, as some suppose, at one period of its history, the air had mixed with it a larger proportion than at present, an increased temperature from its action, as well as from an increased weight, must have necessarily resulted.”
Foote’s paper went largely unnoticed until it was rediscovered in the last decade. If you’re interested, the best thing I’ve read on the history of climate change is the 7th chapter of Charles Mann’s The Wizard and the Prophet.
I’d missed that Randall Munroe has been doing videos based on his What If? website and books. The one I ran across the other day is about earthquakes:
Since we usually hear about earthquakes with ratings somewhere between 3 and 9, a lot of people probably think of 10 as the top of the scale and 0 as the bottom. In fact, there is no top or bottom to the scale!
There are three more short videos on the channel so far: What if Earth suddenly stopped spinning?, What if NASCAR had no rules?, and What if we aimed the Hubble Telescope at Earth? Good stuff.
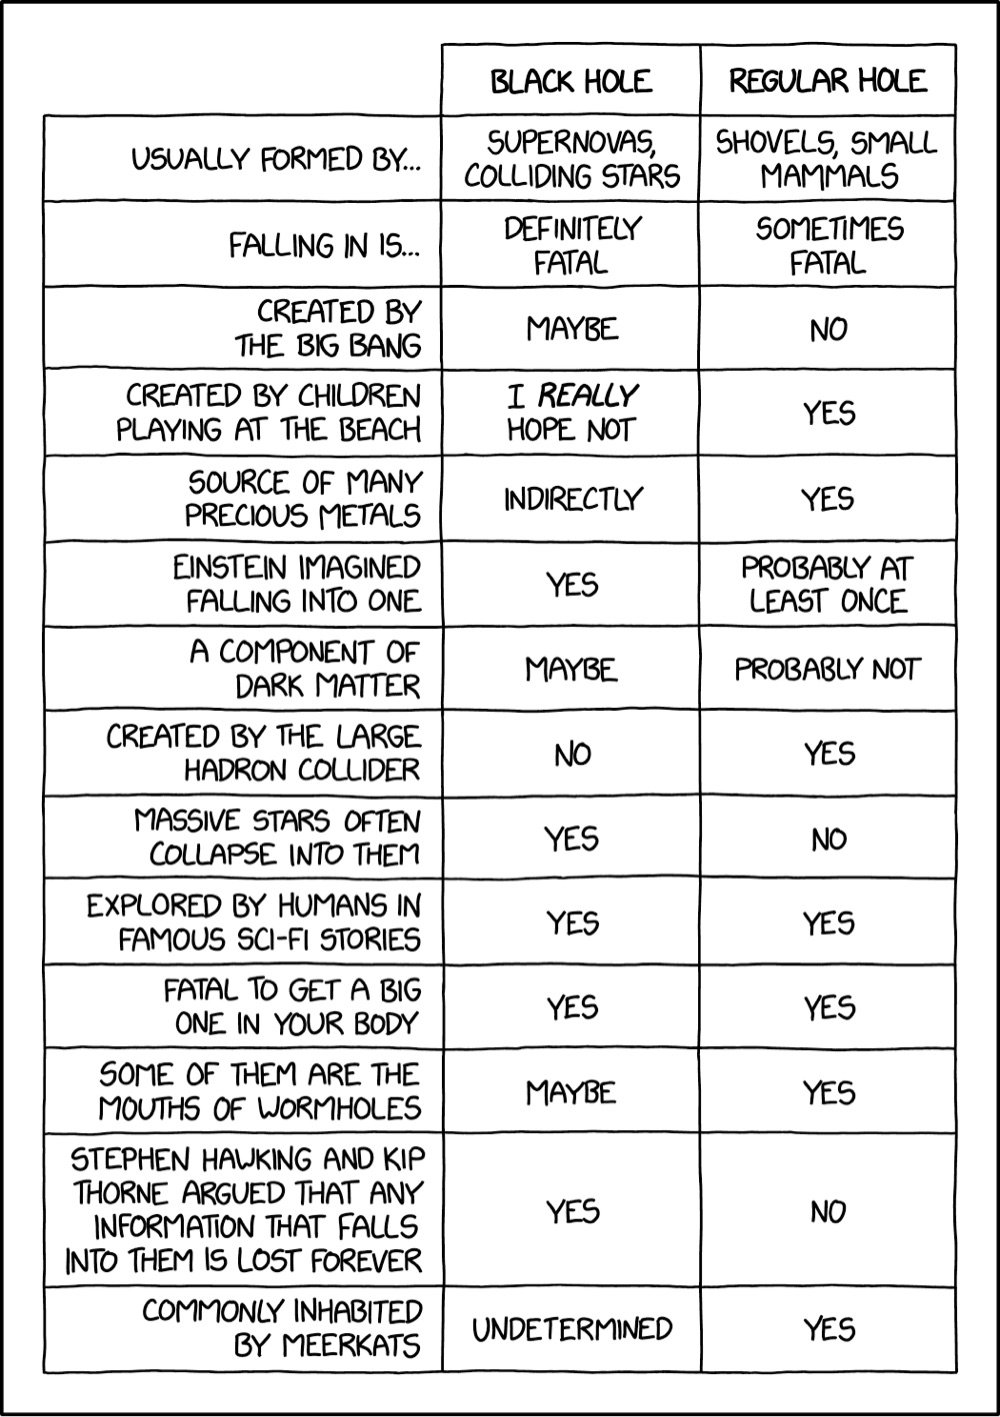
From XKCD, a comparison chart that shows how black holes and regular holes measure up to one another. Some of these are pretty clever: “some of them are the mouths of wormholes”.
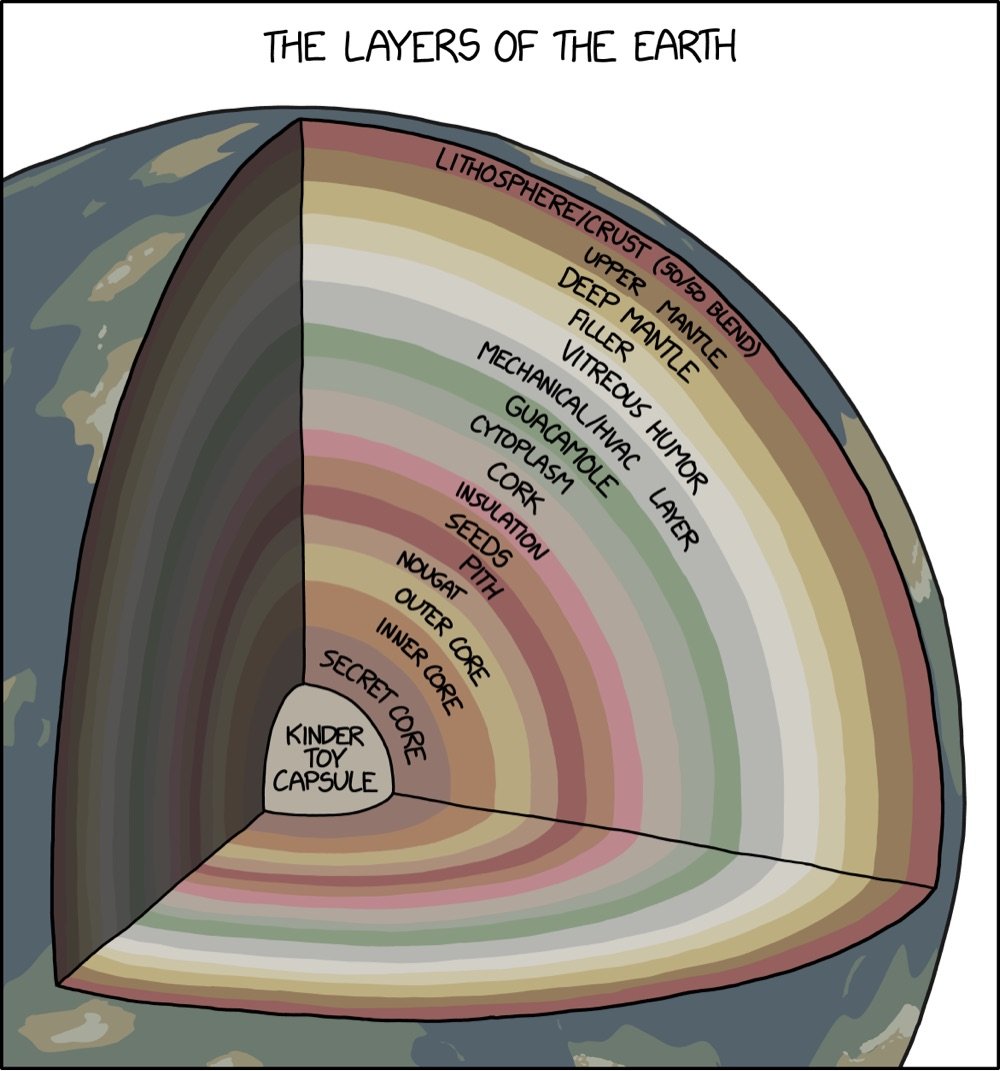
From XKCD, a 3D cutaway map of the many layers of the Earth, from the familiar crust around the outside to the more mysterious layers like nougat, vitreous humor, guacamole, and cork.

From XKCD, the progression of people’s opinions about cars & urban planning, from “I wish there wasn’t so much traffic to get into the city. They should put in more lanes.” to “Anything that makes a city a worse place to drive makes it a better place to live.” As The War on Cars said on Bluesky, “Randall Munroe, welcome to The War on Cars.”
P.S. Re: putting in more lanes, read up on induced demand and road dieting for why that’s often not a great idea.
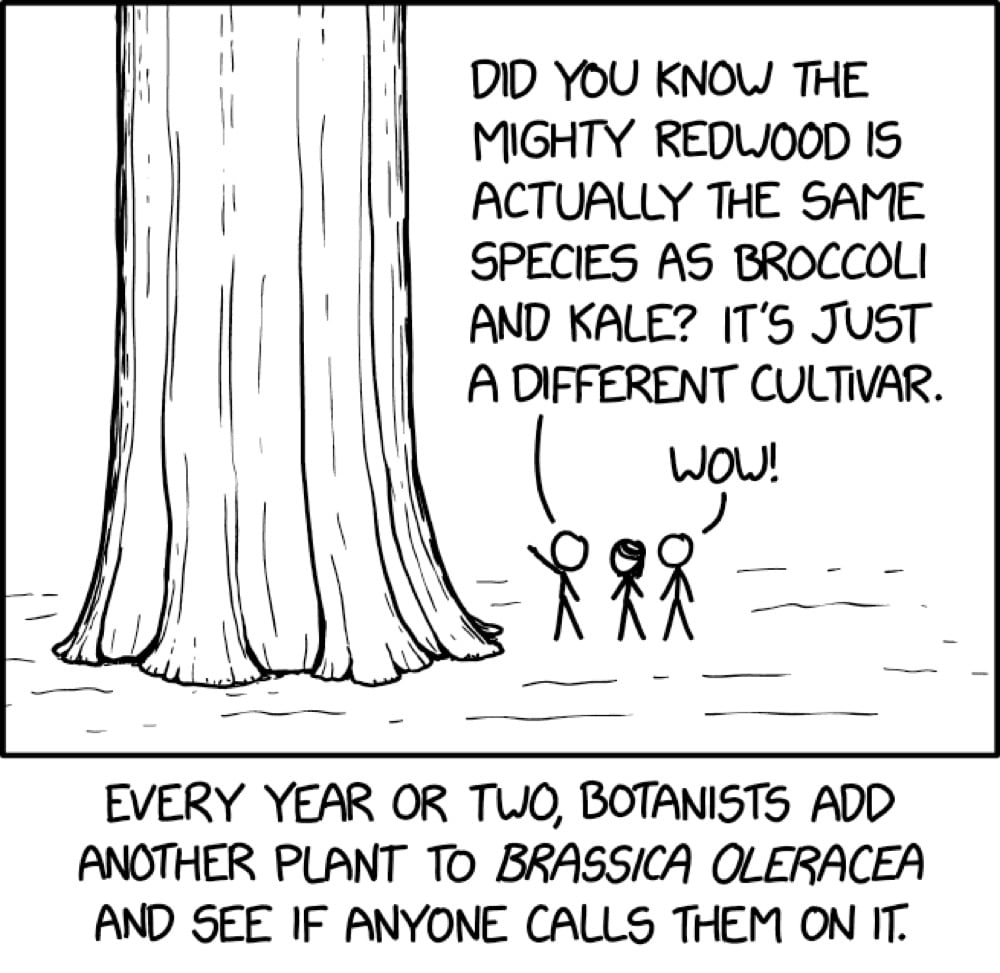
For a recent XKCD, Randall Munroe celebrates the the magical brassica oleracea plant.
Brassica oleracea is a species of plant that, like the apple, has a number of different cultivars. But these cultivars differ widely from each other: cabbage, kale, broccoli, brussels sprouts, kohlrabi, collard greens, and cauliflower.
Welcome, redwood, to the family, er, species.
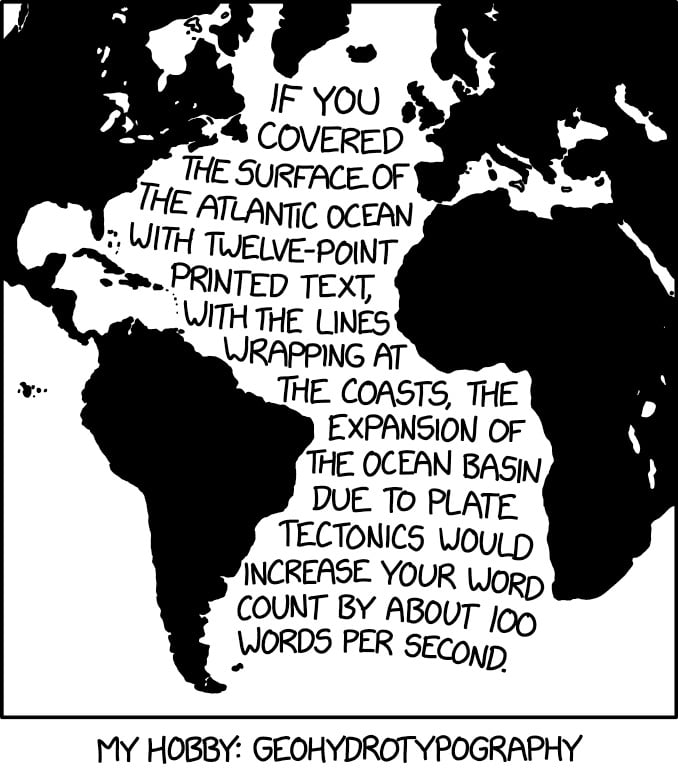
This, from XKCD, hits my science and design interests right in the sweet spot.
If you covered the surface of the Atlantic Ocean with twelve-point printed text, with the lines wrapping at the coasts, the expansion of the ocean basin due to tectonics would increase your word count by about 100 words per second.
This reminds me of Ben Terrett’s calculation of how many helveticas from here to the Moon and my subsequent calculations about the point size of the Earth and the Moon (50.2 billion and 13.7 billion, respectively).
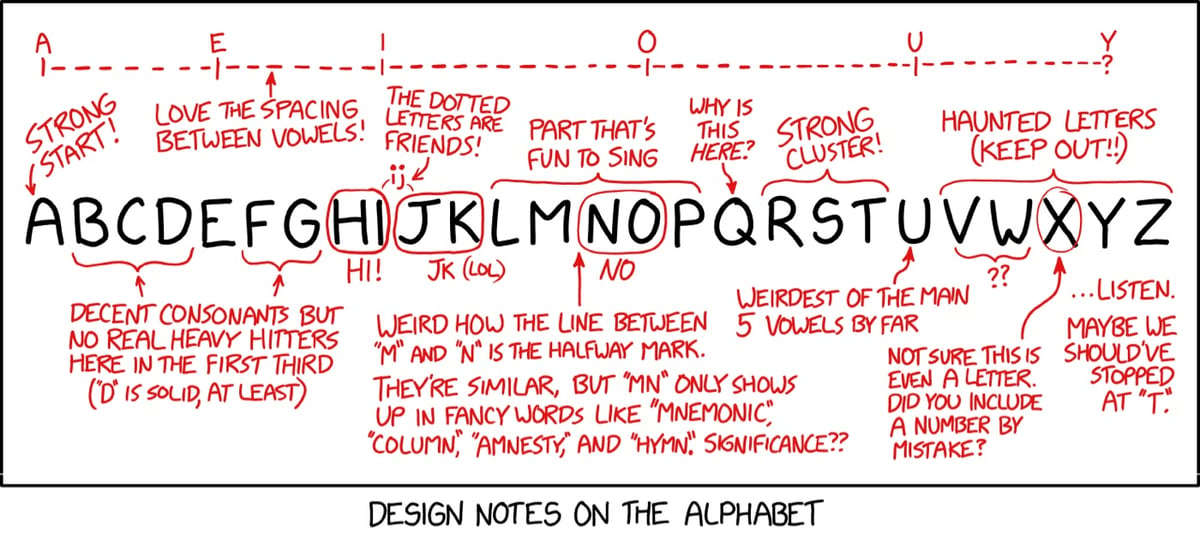
From XKCD, some notes on the design of the alphabet. I actually hadn’t noticed the spacing of the vowels before.
See also The Evolution of the Alphabet.
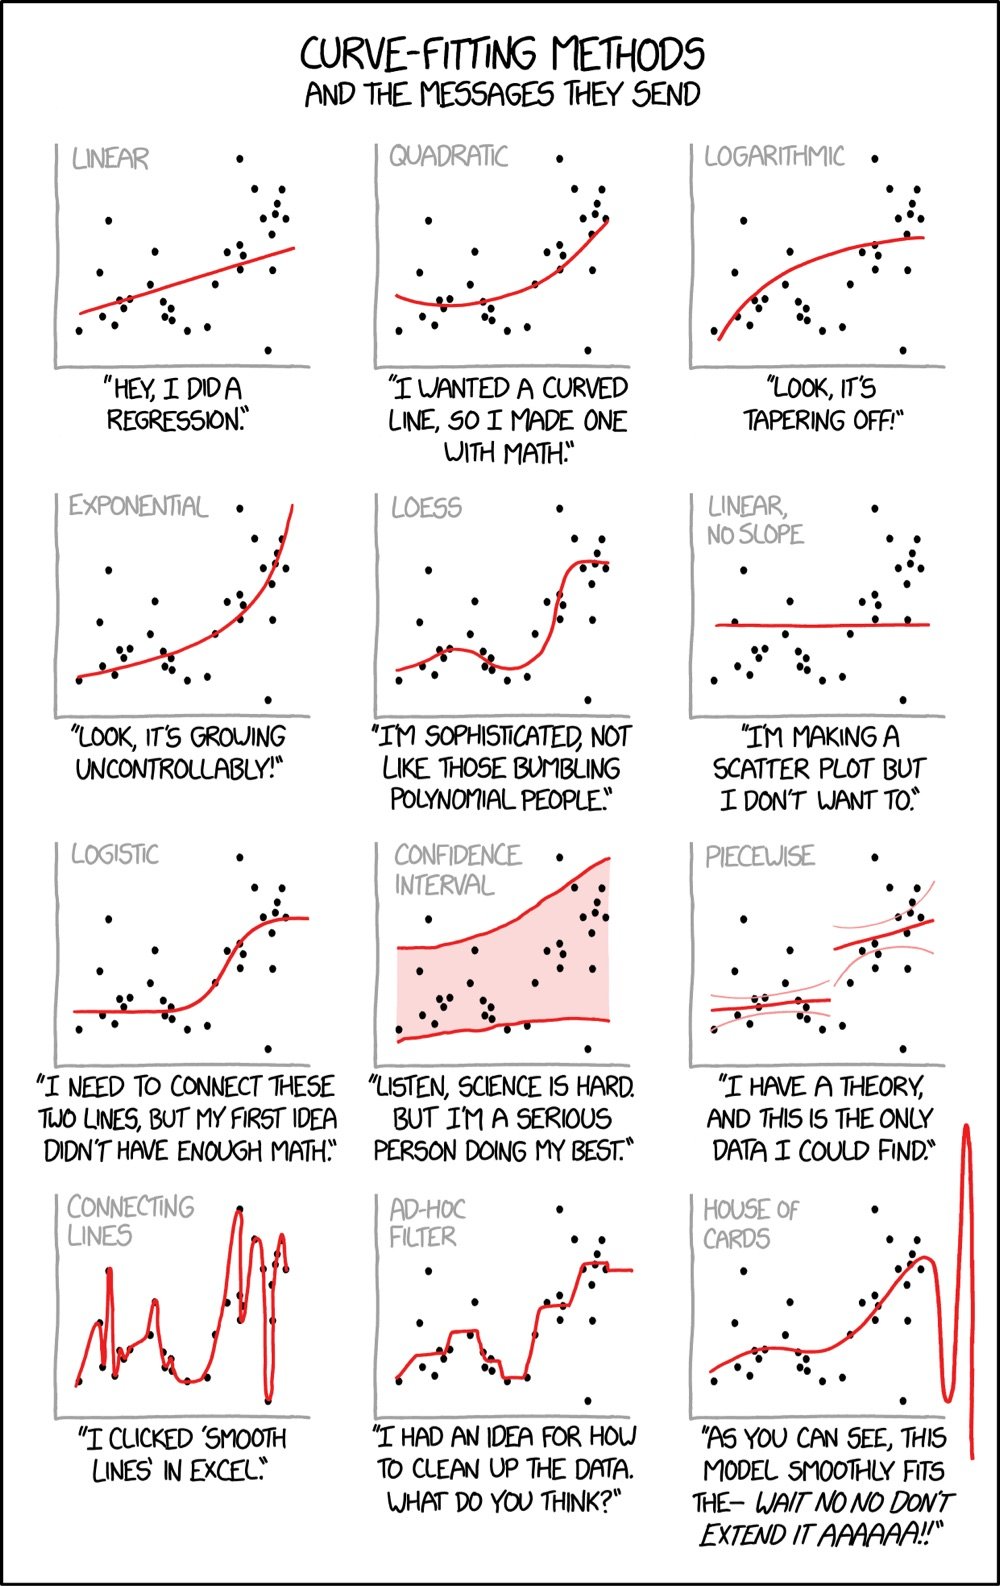
From XKCD, Curve-Fitting Methods and the Messages They Send. Ahhhh, this takes me back to my research days in college, tinkering with best fits and R-squared values…
XKCD’s Randall Munroe recently shared some of the pages from his grandfather’s collection of Disfrustrating Puzzles and Diversions for People Who Don’t Have Time for the Hard Ones and….I cannot stop laughing at some of these.
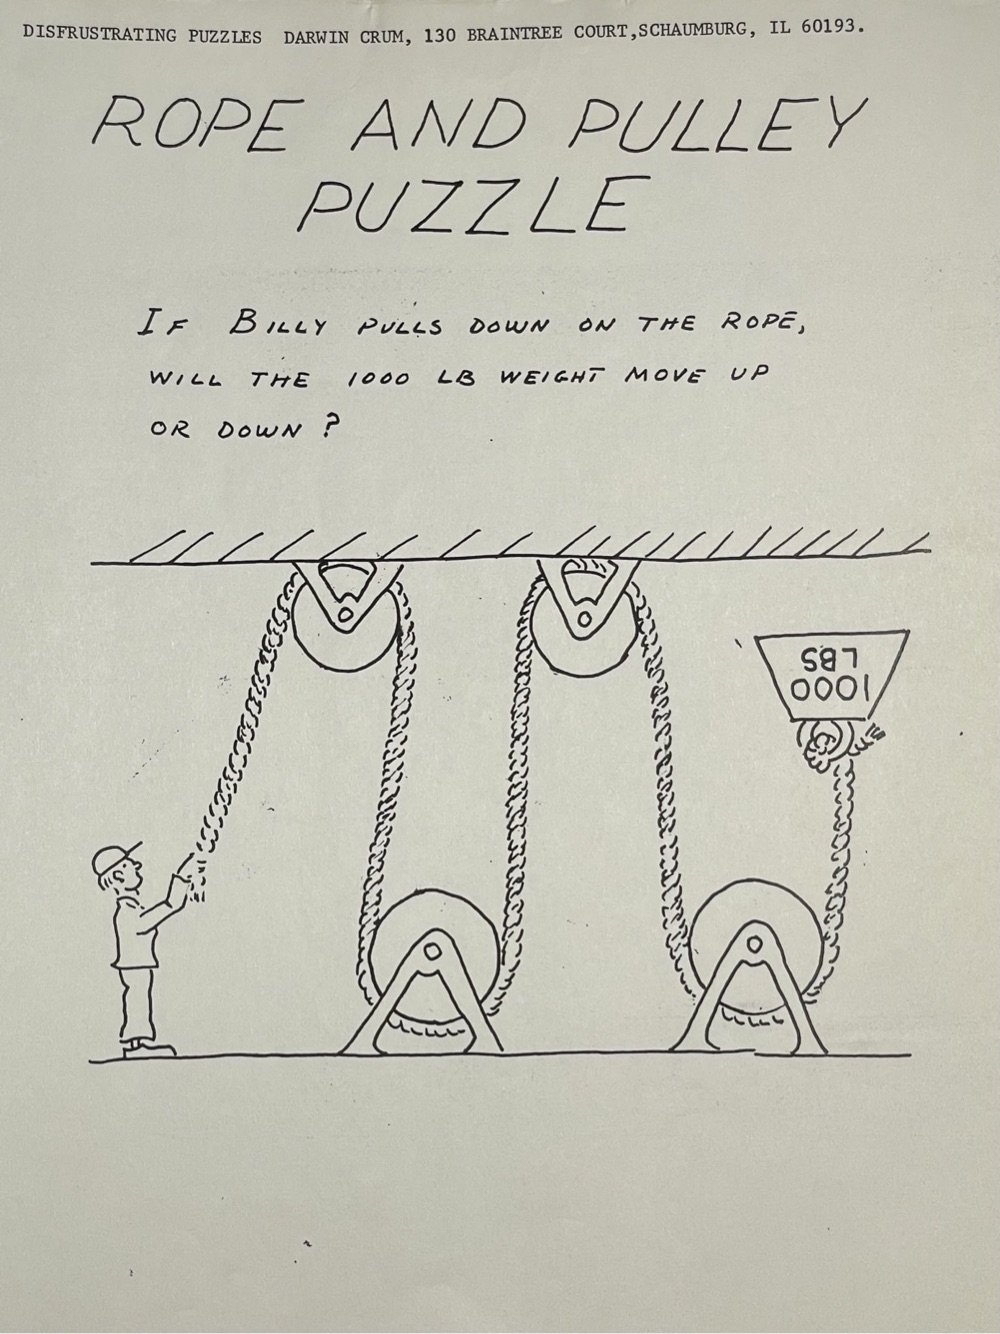
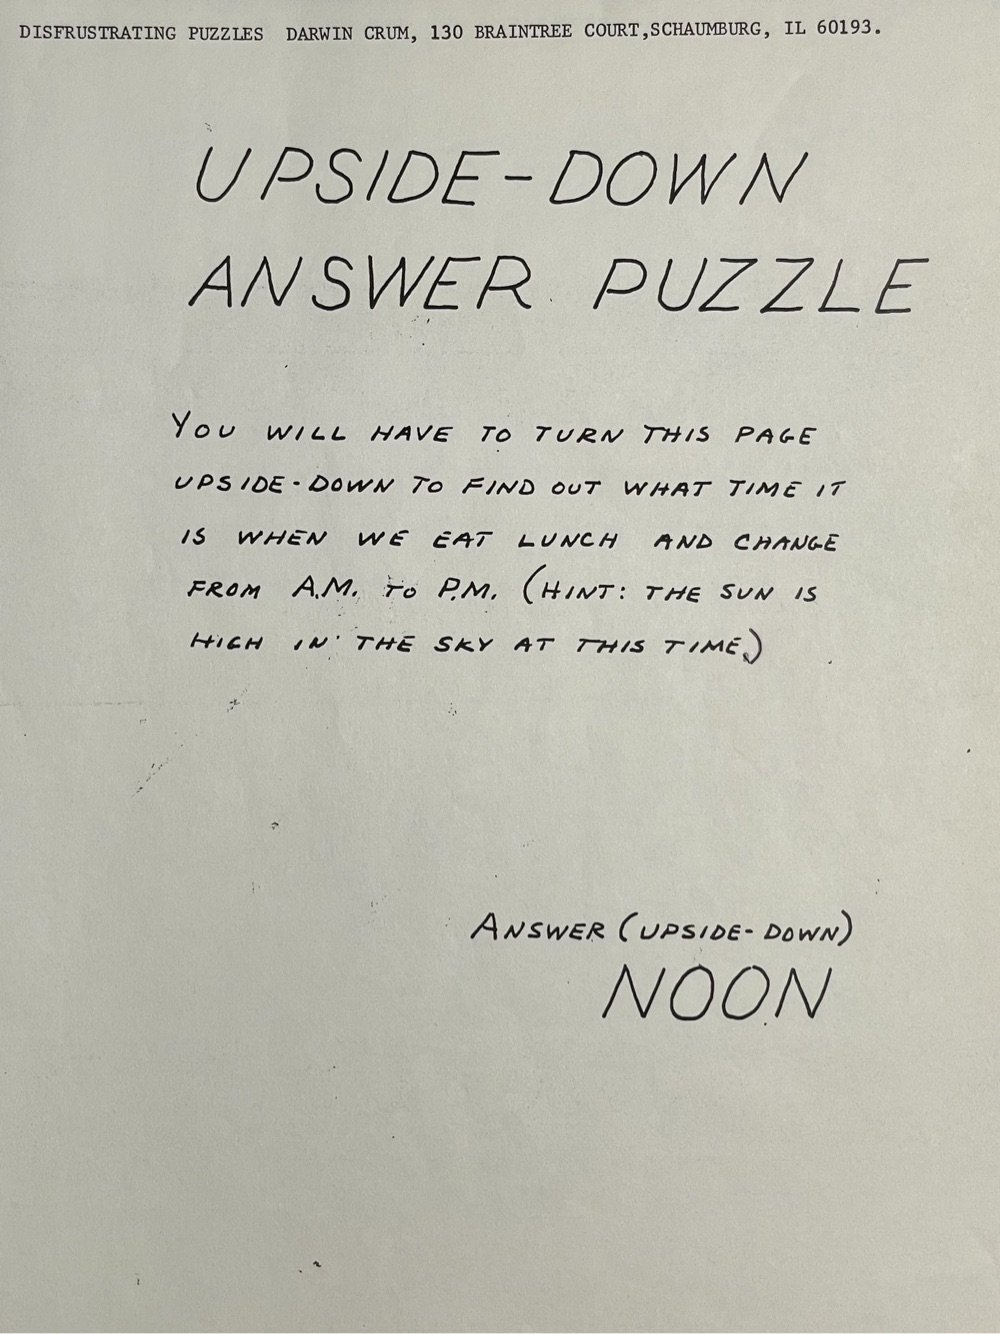
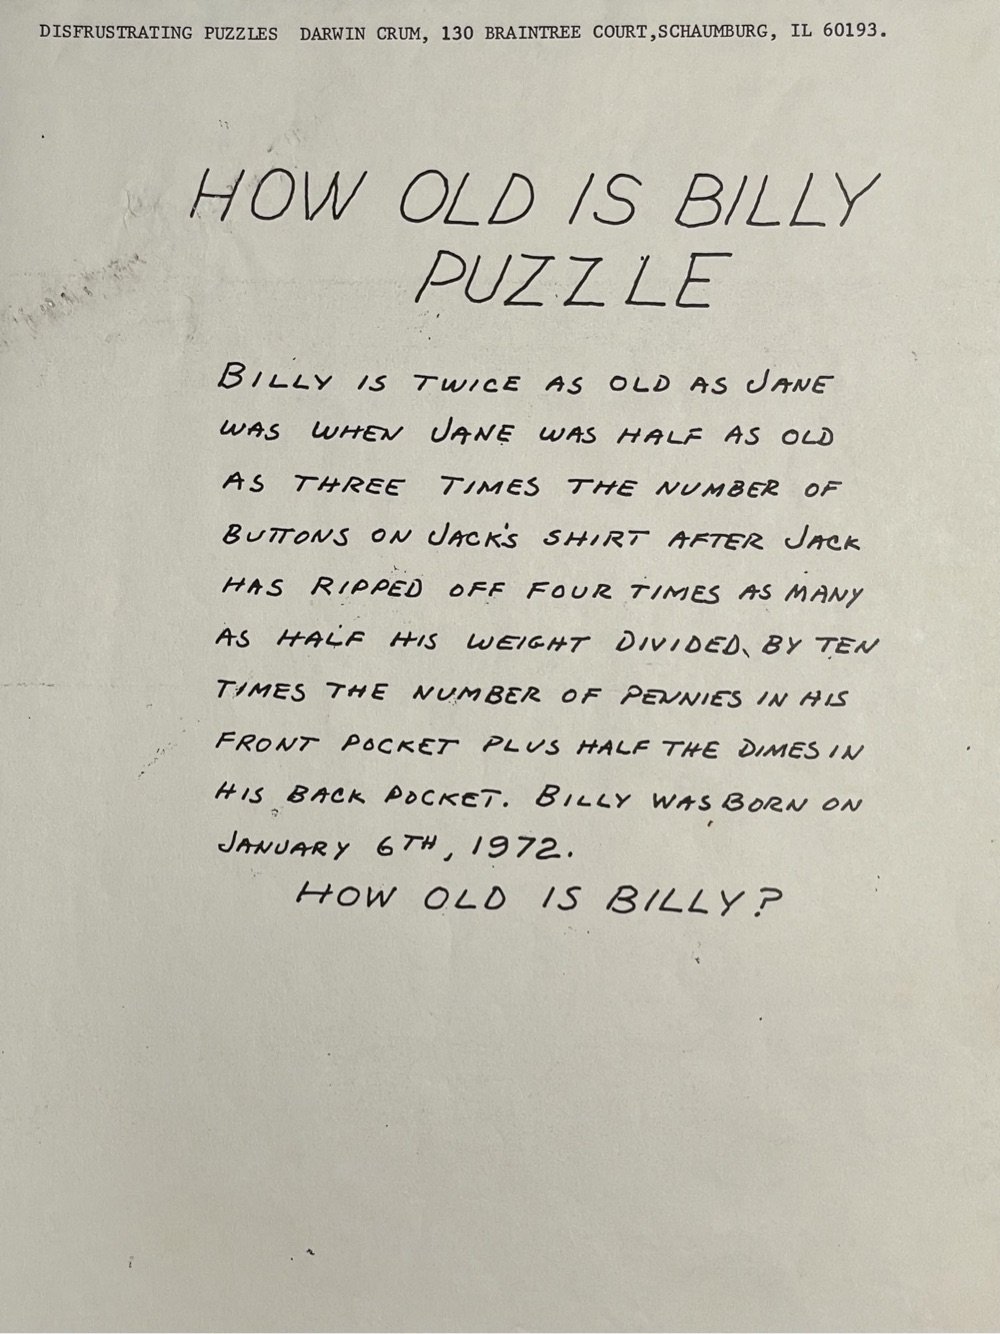
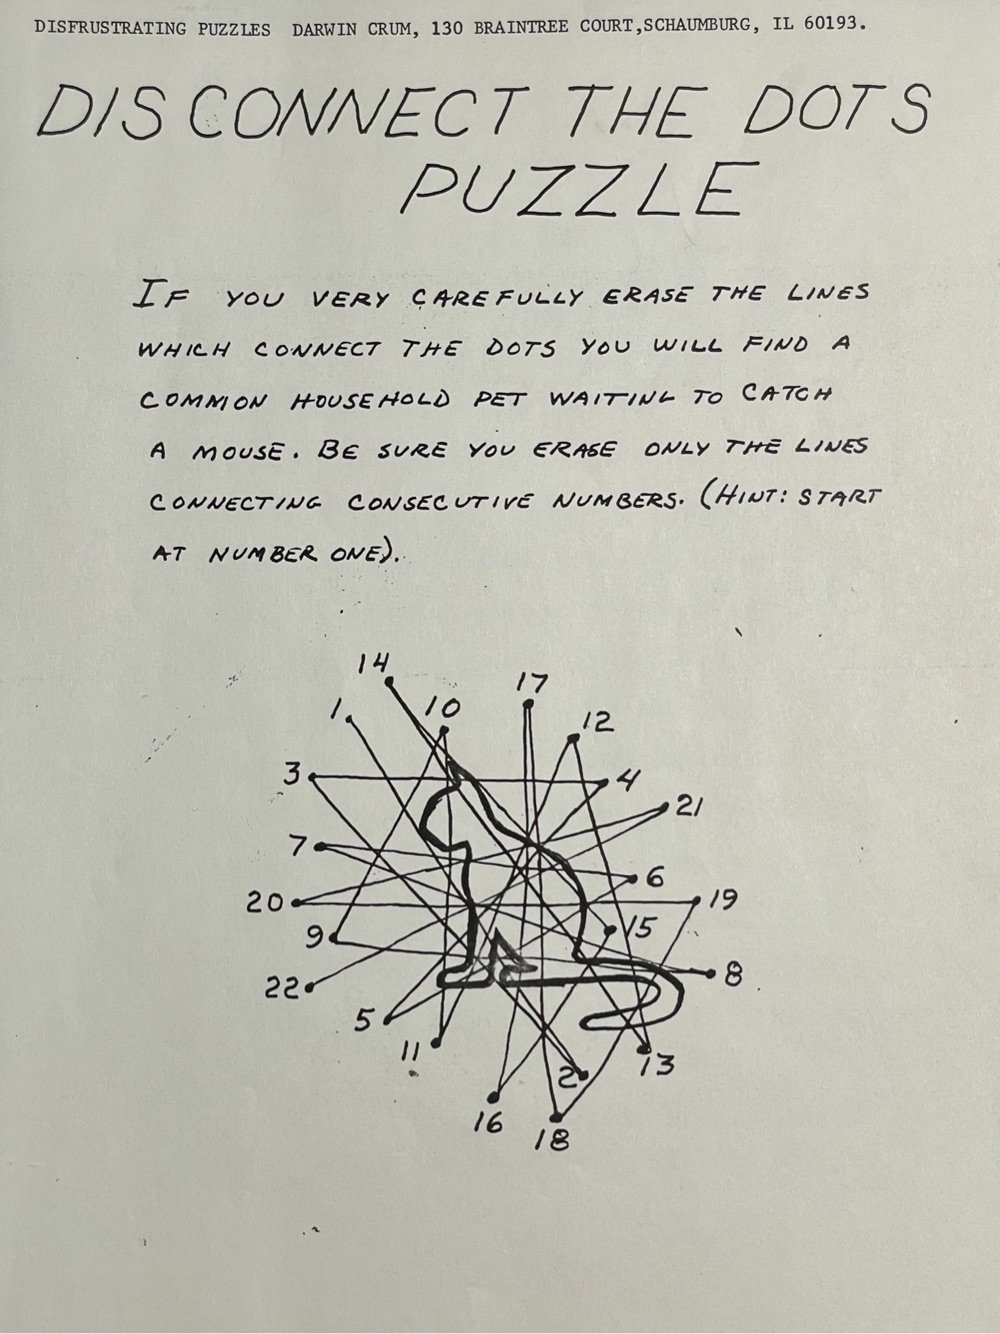
Welp, it’s no mystery where XKCD came from then.
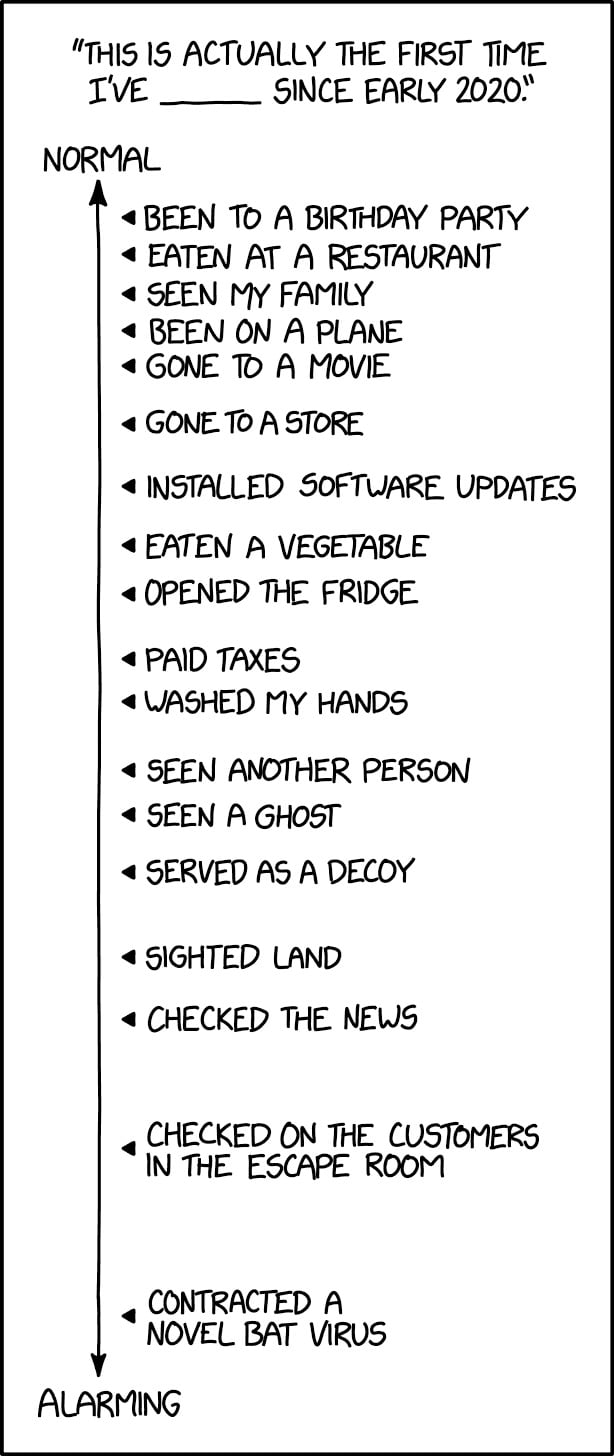
For many of us in the US and other parts of the world, with Covid-19 on the decline because of vaccinations, the last month or two has seen people getting back into the world for the first time since the pandemic began in early 2020. XKCD’s Randall Munroe plotted out some of these experiences on a scale from “normal” to “alarming”:
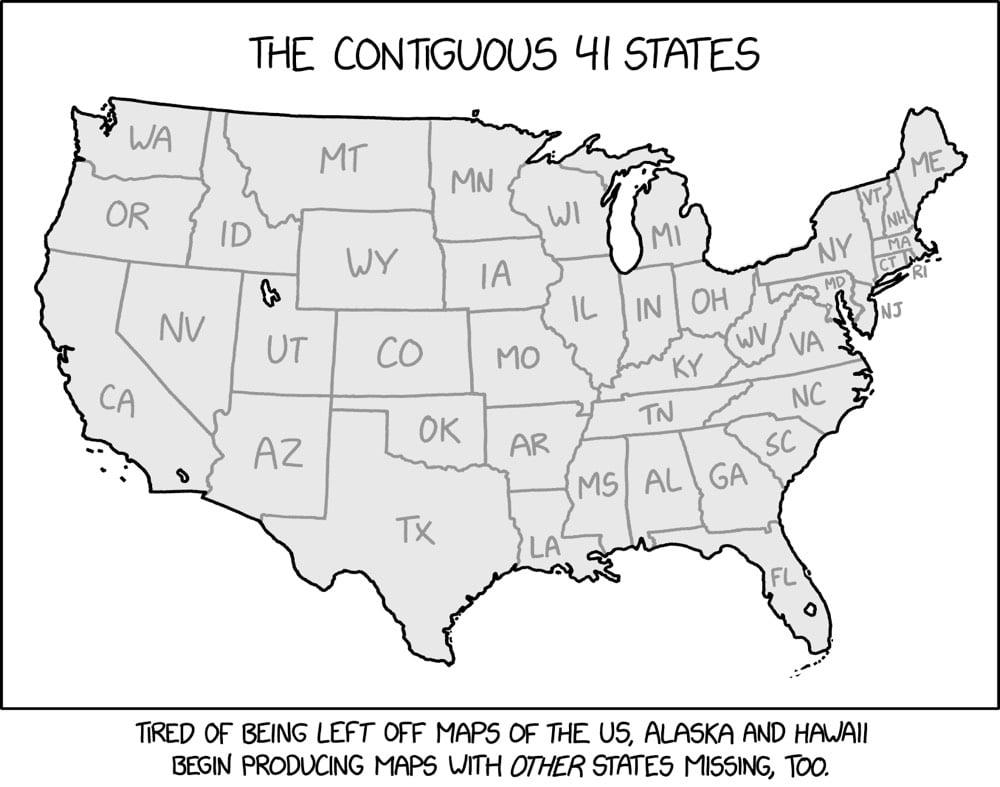
This map of the lower 48 US states hand-drawn by XKCD’s Randall Munroe is super clever: 7 of the states are actually missing. Maybe the pandemic is starting continuing to rot my brain, but I stared at this for an embarrassingly long time before finding any of the absent states. Even now that I know which ones are gone, the map doesn’t look out of place at all. *claps*
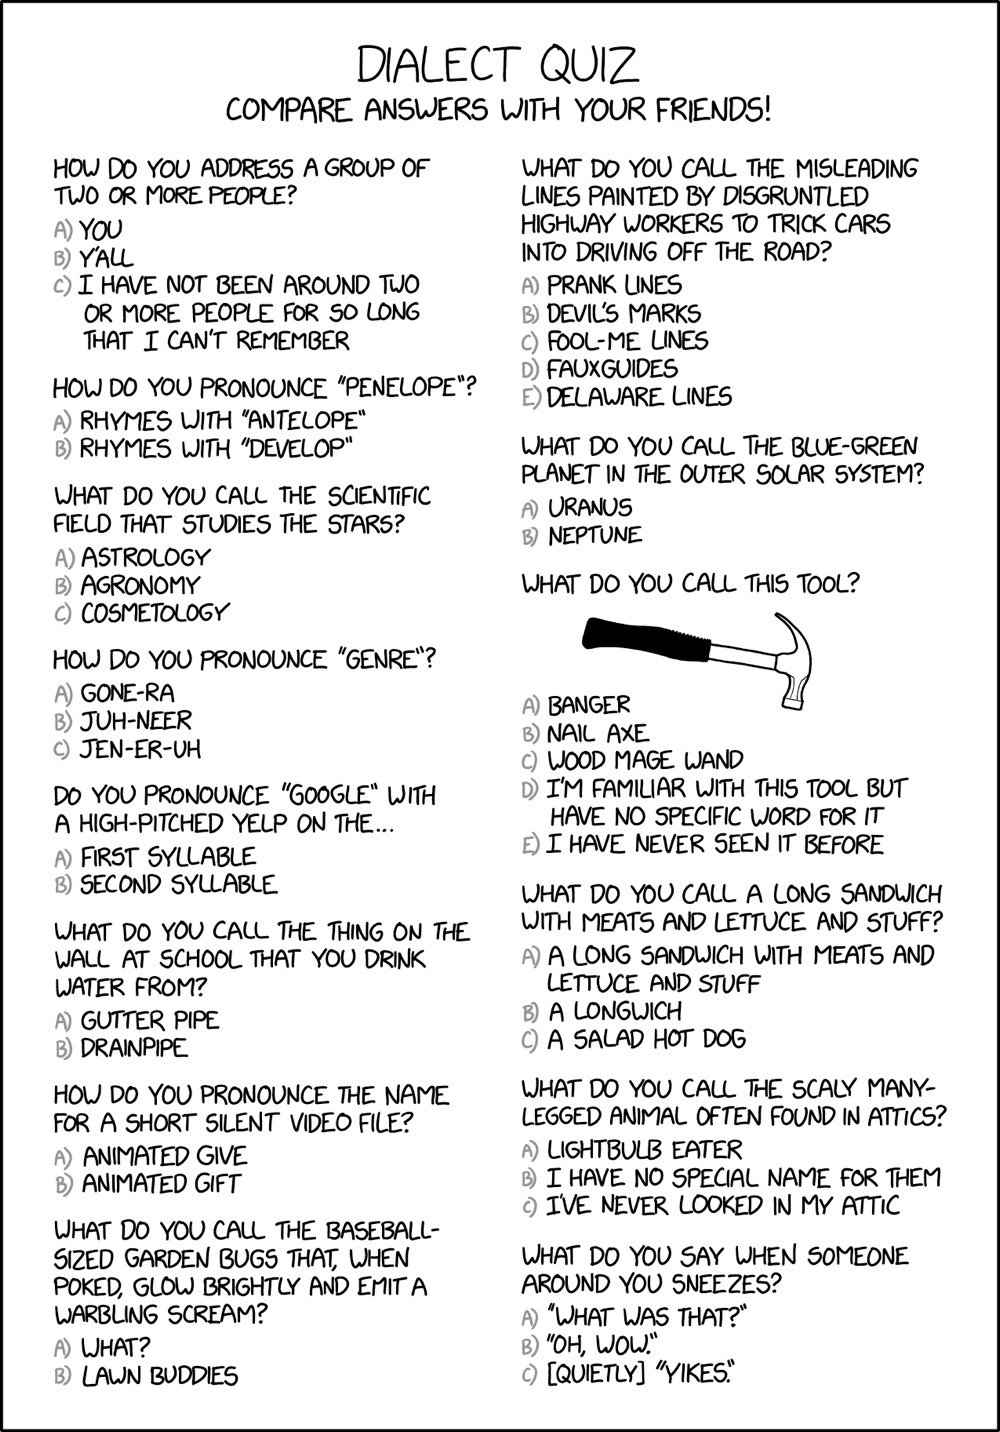
Remember when dialect quizzes and maps were a thing? XKCD is joining the fun with their own quiz. Reader, I giggled when I got to “lawn buddies” and full-on laughed at “longwich”. Longwich is totally going in my vocabulary arsenal.
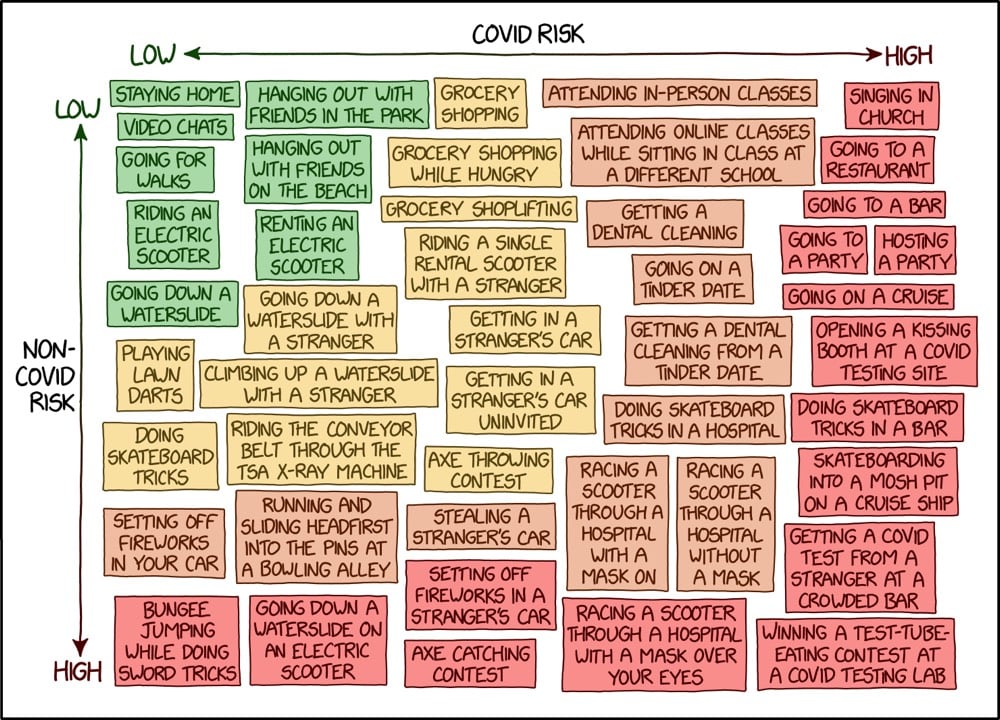
If you’ve been wondering about the risk of contracting Covid-19 while performing common activities vs. the risk of doing stupid shit, XKCD has you covered. I feel like “getting a dental cleaning from a Tinder date” should have been much more high risk than its position on the chart.
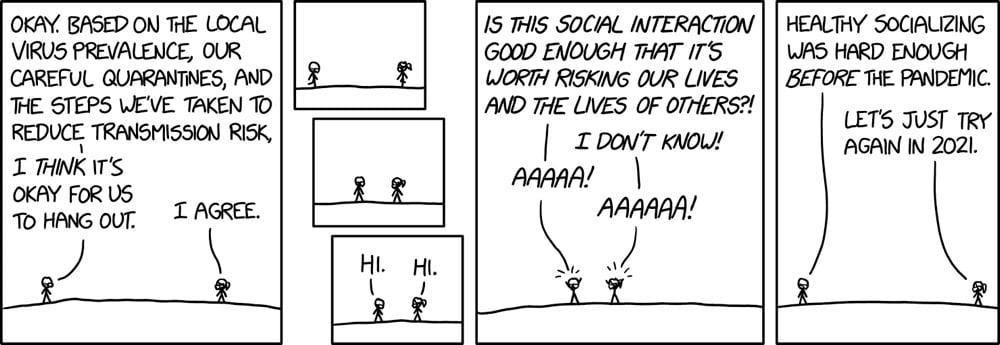
Some Americans obviously aren’t troubling themselves with this but many of us are constantly running risk calculations in our heads for every little thing we do and don’t do during the course of the week during the pandemic.
Is it ok to visit the grocery store more than once this week? Can my kid have a playdate with her friend? Has her friend’s family been careful about seeing other people and how do I even ask them about it without sounding judgmental? Should I order that thing online or go to the store for it? Is it safe to take a roadtrip to a neighboring state? (Where the hell are we supposed to stop to use the bathroom?) Can I get a haircut? Do I need to order that thing online or do I just want it? Should schools reopen in the fall? And if they do, should I send my kids? Is eating at a restaurant safe for the staff? Can a friend come over for dinner? Can my son safely play in a baseball league? Will there be too many people not wearing masks in the store that I need to visit to get this one thing? Should I keep going to my favorite coffee shop when the barista just can’t seem to keep his mask up over his nose?
It goes on and on and on and IT’S EXHAUSTING. Comic from XKCD.
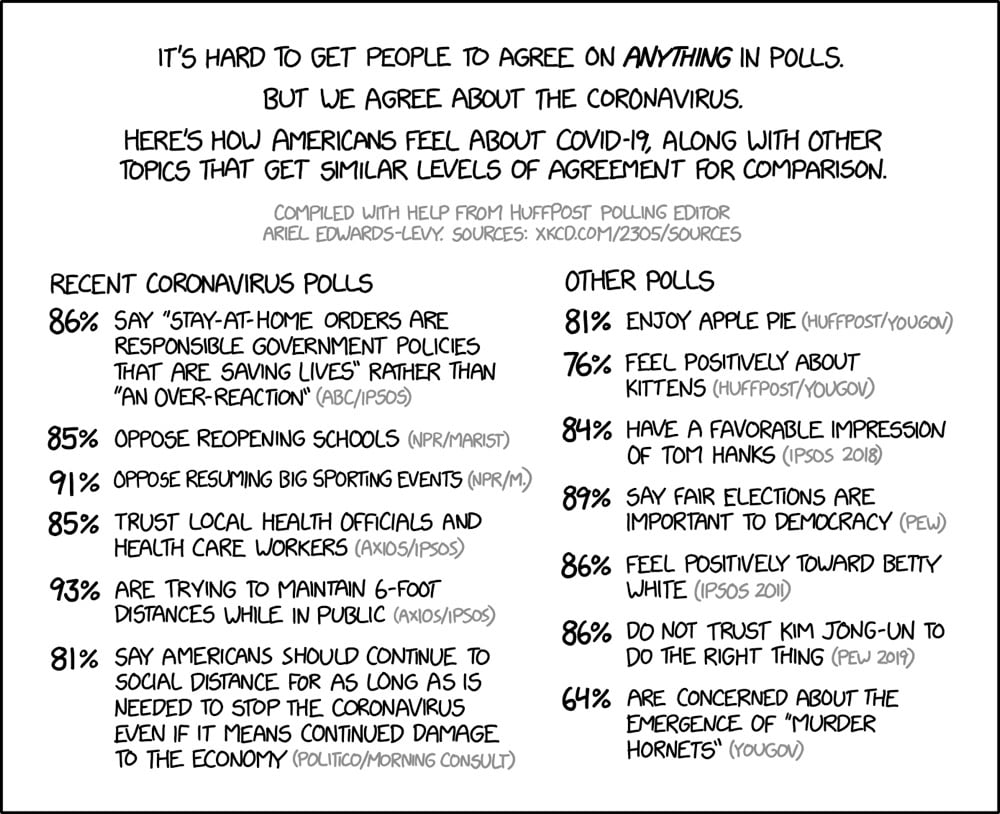
Recent polling compiled by Randall Munroe indicates that Americans agree on what to do about the Covid-19 pandemic to a greater extent than they “feel positively about kittens” or even “enjoy apple pie”.

This animated gif from XKCD is the pitch perfect tribute to John Conway, who died of Covid-19 at the age of 82. Conway was the inventor of the Game of Life and an all-around brilliant and creative person.
Tim Qian has created a Javascript library called chart.xkcd for making charts that look hand-drawn in the style of XKCD.
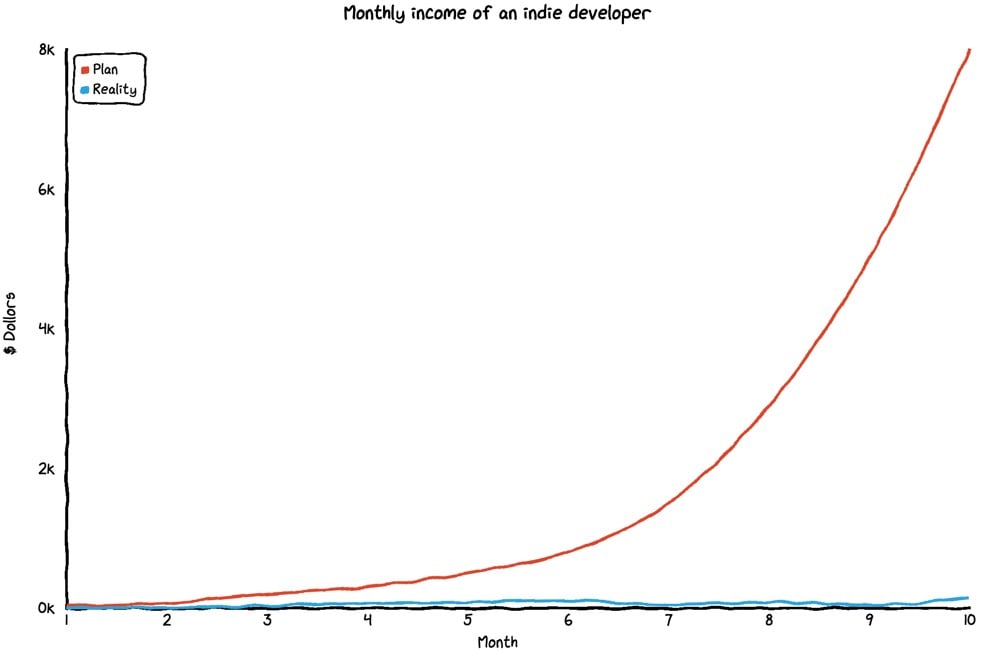
It’s easy to get started with chart.xkcd. All that’s required is the script included in your page along with a single
You can use it to make line charts, XY charts, bar charts, radar charts, and pie/doughnut charts. I am definitely going to be using this in the future.
Speaking of XKCD, Randall Munroe has a new NY Times column called Good Question where he answers odd science questions (a la What If?). The first installment: If I Touched the Moon, What Would It Feel Like?
Moon dust may not burn you, but it’s no picnic. Like Earth sand, moon dust is effectively made of tiny glass shards, but the sharp edges have not been worn down by erosion. As a result, it can be pretty unhealthy.
(via sidebar)
The latest installment of XKCD’s What If? column starts off by answering a question about how tall your Twitter timeline would be if it extended off the screen.
On my computer’s monitor, the average tweet is about 2.4 centimeters high. This suggests that Jeph Jacques’ tweet tower is 900 meters tall-taller than the tallest building-and still growing.
However, Jeph has nothing on @YOUGAKUDAN_00, who tweets many times per minute — usually binary, but sometimes actual words. @YOUGAKUDAN_00 has accumulated 37 million tweets, enough to reach into low Earth orbit.
But then a more interesting question is explored…how long will Twitter last?
Suppose you’re transported to an alternate universe. You open IMDb and load a random page, and the movie that comes up is The Land Before Time XXVII.
Based only on the title, how many Land Before Time movies do you think there are in this universe? Clearly there are at least 27, and probably more.
Allied troops faced a version of this problem in World War II. German tank parts had serial numbers, many of which were sequential (1, 2 … N). Suppose they captured a random tank. If they determined it was Tank #27, then they can be sure that the Germans had made at least 27 tanks. It also told them there probably weren’t millions of tanks; if there were, they would have been unlikely to get a two-digit serial number.
Ah, the good old days, when people used to talk to each other in public rather than looking at their phones or listening to headphones all the time. Except that’s not been the case for awhile as XKCD demonstrates with a series of quotes from various publications dating back to 1871. This is from William Smith’s Morley: Ancient and Modern published in 1886.
With the advent of cheap newspapers and superior means of locomotion… the dreamy quiet old days are over… for men now live think and work at express speed. They have their Mercury or Post laid on their breakfast table in the early morning, and if they are too hurried to snatch from it the news during that meal, they carry it off, to be sulkily read as they travel… leaving them no time to talk with the friend who may share the compartment with them… the hurry and bustle of modern life… lacks the quiet and repose of the period when our forefathers, the day’s work done, took their ease…
In 1946, a young Stanley Kubrick worked as a photographer for Look magazine and took this shot of NYC subway commuters reading newspapers:
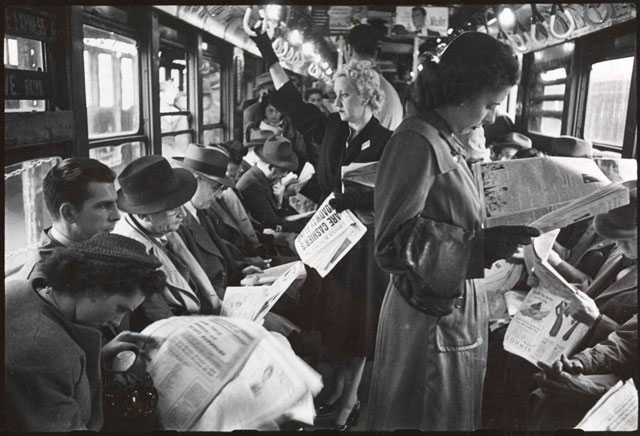
The more things change, etc. More of Kubrick’s subway photography can be found here.
Today’s XKCD must have taken Randall several years to draw…if you click and drag, it goes on forever. Or not quite forever, but Dan Catt did some figuring and:
Ok, so the XKCD map printed at 300dpi is around 46 foot / 14 meters wide, half that at magazine 600dpi quality.
Here’s a better Google Maps-like way to explore the entire world.
IHOP meets House of Leaves. This will only be funny if you’ve read the book.
From the always excellent xkcd, this comic absolutely drips hilarious nerdiness and nerdy hilariousness all over the place. “Oh yes, Little Bobby Tables, we call him.”
Stay Connected