kottke.org posts about maps
New Google Maps feature: Street View. Just place your little guy on a street on the map and up pops a 3-D panorama of what you’d see on the street. For instance, here’s a view into oncoming traffic on the Brooklyn Bridge. Only major US cities are supported for now. I remember Amazon’s A9 came out with something like this a couple of years ago, but Google’s implementation of it is fantastic. (thx, mark)
A “story map” distributed to guests of a wedding that shows the possible occupational, relational, and recreational relationships between guests to be used as a conversational cheat-sheet. Reminiscent of Mark Lombardi’s network maps. Better larger. (via gulfstream)
Another kind of Tube map: which seating/standing positions in the carriage are the best and which are the worst? “Everyone knows the prime seats and standing spots, and people jostle for supremacy when the doors open, especially at the depot, when the train is empty.”
Projected climate map of Europe in 2071. The map is a bit confusing…the cities are placed on the map according to their projected new climate, not their geographical location. So, in 2071, Berlin will find itself in the same climate as circa-2007 North Africa.
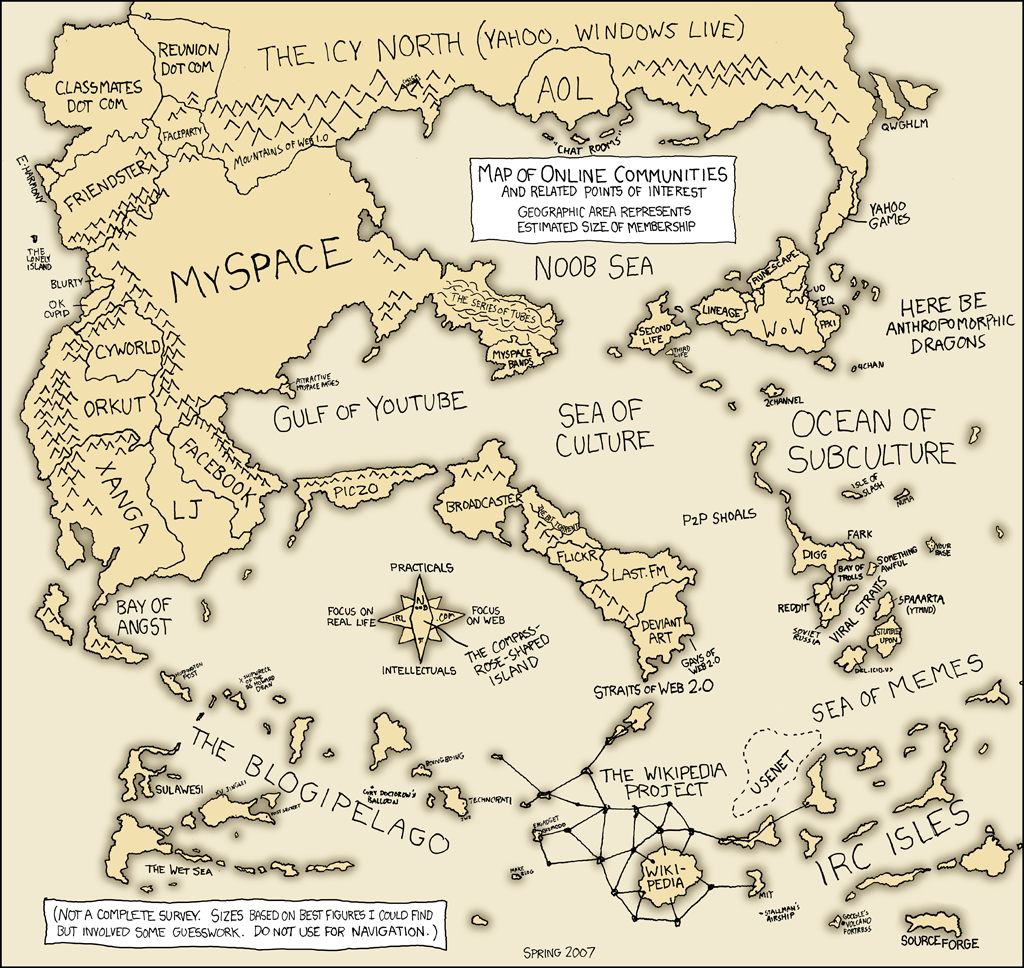
A map of online communities. Notable features include the Blogipeligo, the Bay of Trolls, the Sea of Memes, and the Viral Straits. (thx, kayhan)
Typographic map of London. That is, a map made of type (like Paula Scher’s paintings) not a map of typography in London. (via moon river)
Big Box Watch is a map that displays future big box store openings in the US. The site currently tracks Best Buy, Home Depot, Ikea, JCPenney, Kohl’s, Lowe’s, Target, and Wal-Mart.
It’s been awhile since I’ve done one of these. Here are some updates on some of the topics, links, ideas, posts, people, etc. that have appeared on kottke.org recently:
Two counterexamples to the assertion that cities != organisms or ecosystems: cancer and coral reefs. (thx, neville and david)
In pointing to the story about Ken Thompson’s C compiler back door, I forgot to note that the backdoor was theoretical, not real. But it could have easily been implemented, which was Thompson’s whole point. A transcript of his original talk is available on the ACM web site. (thx, eric)
ChangeThis has a “manifesto” by Nassim Taleb about his black swan idea. But reader Jean-Paul says that Taleb’s idea is not that new or unique. In particular, he mentions Alain Badiou’s Being and Event, Jacques Derrida, and Gilles Deleuze. (thx, paul & jean-paul)
When I linked The Onion’s ‘Most E-Mailed’ List Tearing New York Times’ Newsroom Apart, I said “I’d rather read a real article on the effect the most popular lists have on the decisions made by the editorial staff at the Times, the New Yorker, and other such publications”. American Journalism Review published one such story last summer, as did the Chicago Tribune’s Hypertext blog and the LA Times (abstract only). (thx, gene & adam)
Related to Kate Spicer’s attempt to slim down to a size zero in 6 weeks: Female Body Shape in the 20th Century. (thx, energy fiend)
Got the following query from a reader:
are those twitter updates on your blog updated automatically when you update your twitter? if so, how did you do it?
A couple of weeks ago, I added my Twitter updates and recent music (via last.fm) into the front page flow (they’re not in the RSS feed, for now). Check out the front page and scroll down a bit if you want to check them out. The Twitter post is updated three times a week (MWF) and includes my previous four Twitter posts. I use cron to grab the RSS file from Twitter, some PHP to get the recent posts, and some more PHP to stick it into the flow. The last.fm post works much the same way, although it’s only updated once a week and needs a splash of something to liven it up a bit.
The guy who played Spaulding in Caddyshack is a real estate broker in the Boston area. (thx, ivan)
Two reading recommendations regarding the Jonestown documentary: a story by Tim Cahill in A Wolverine Is Eating My Leg and Seductive Poison by former People’s Temple member Deborah Layton. (thx, garret and andrea)
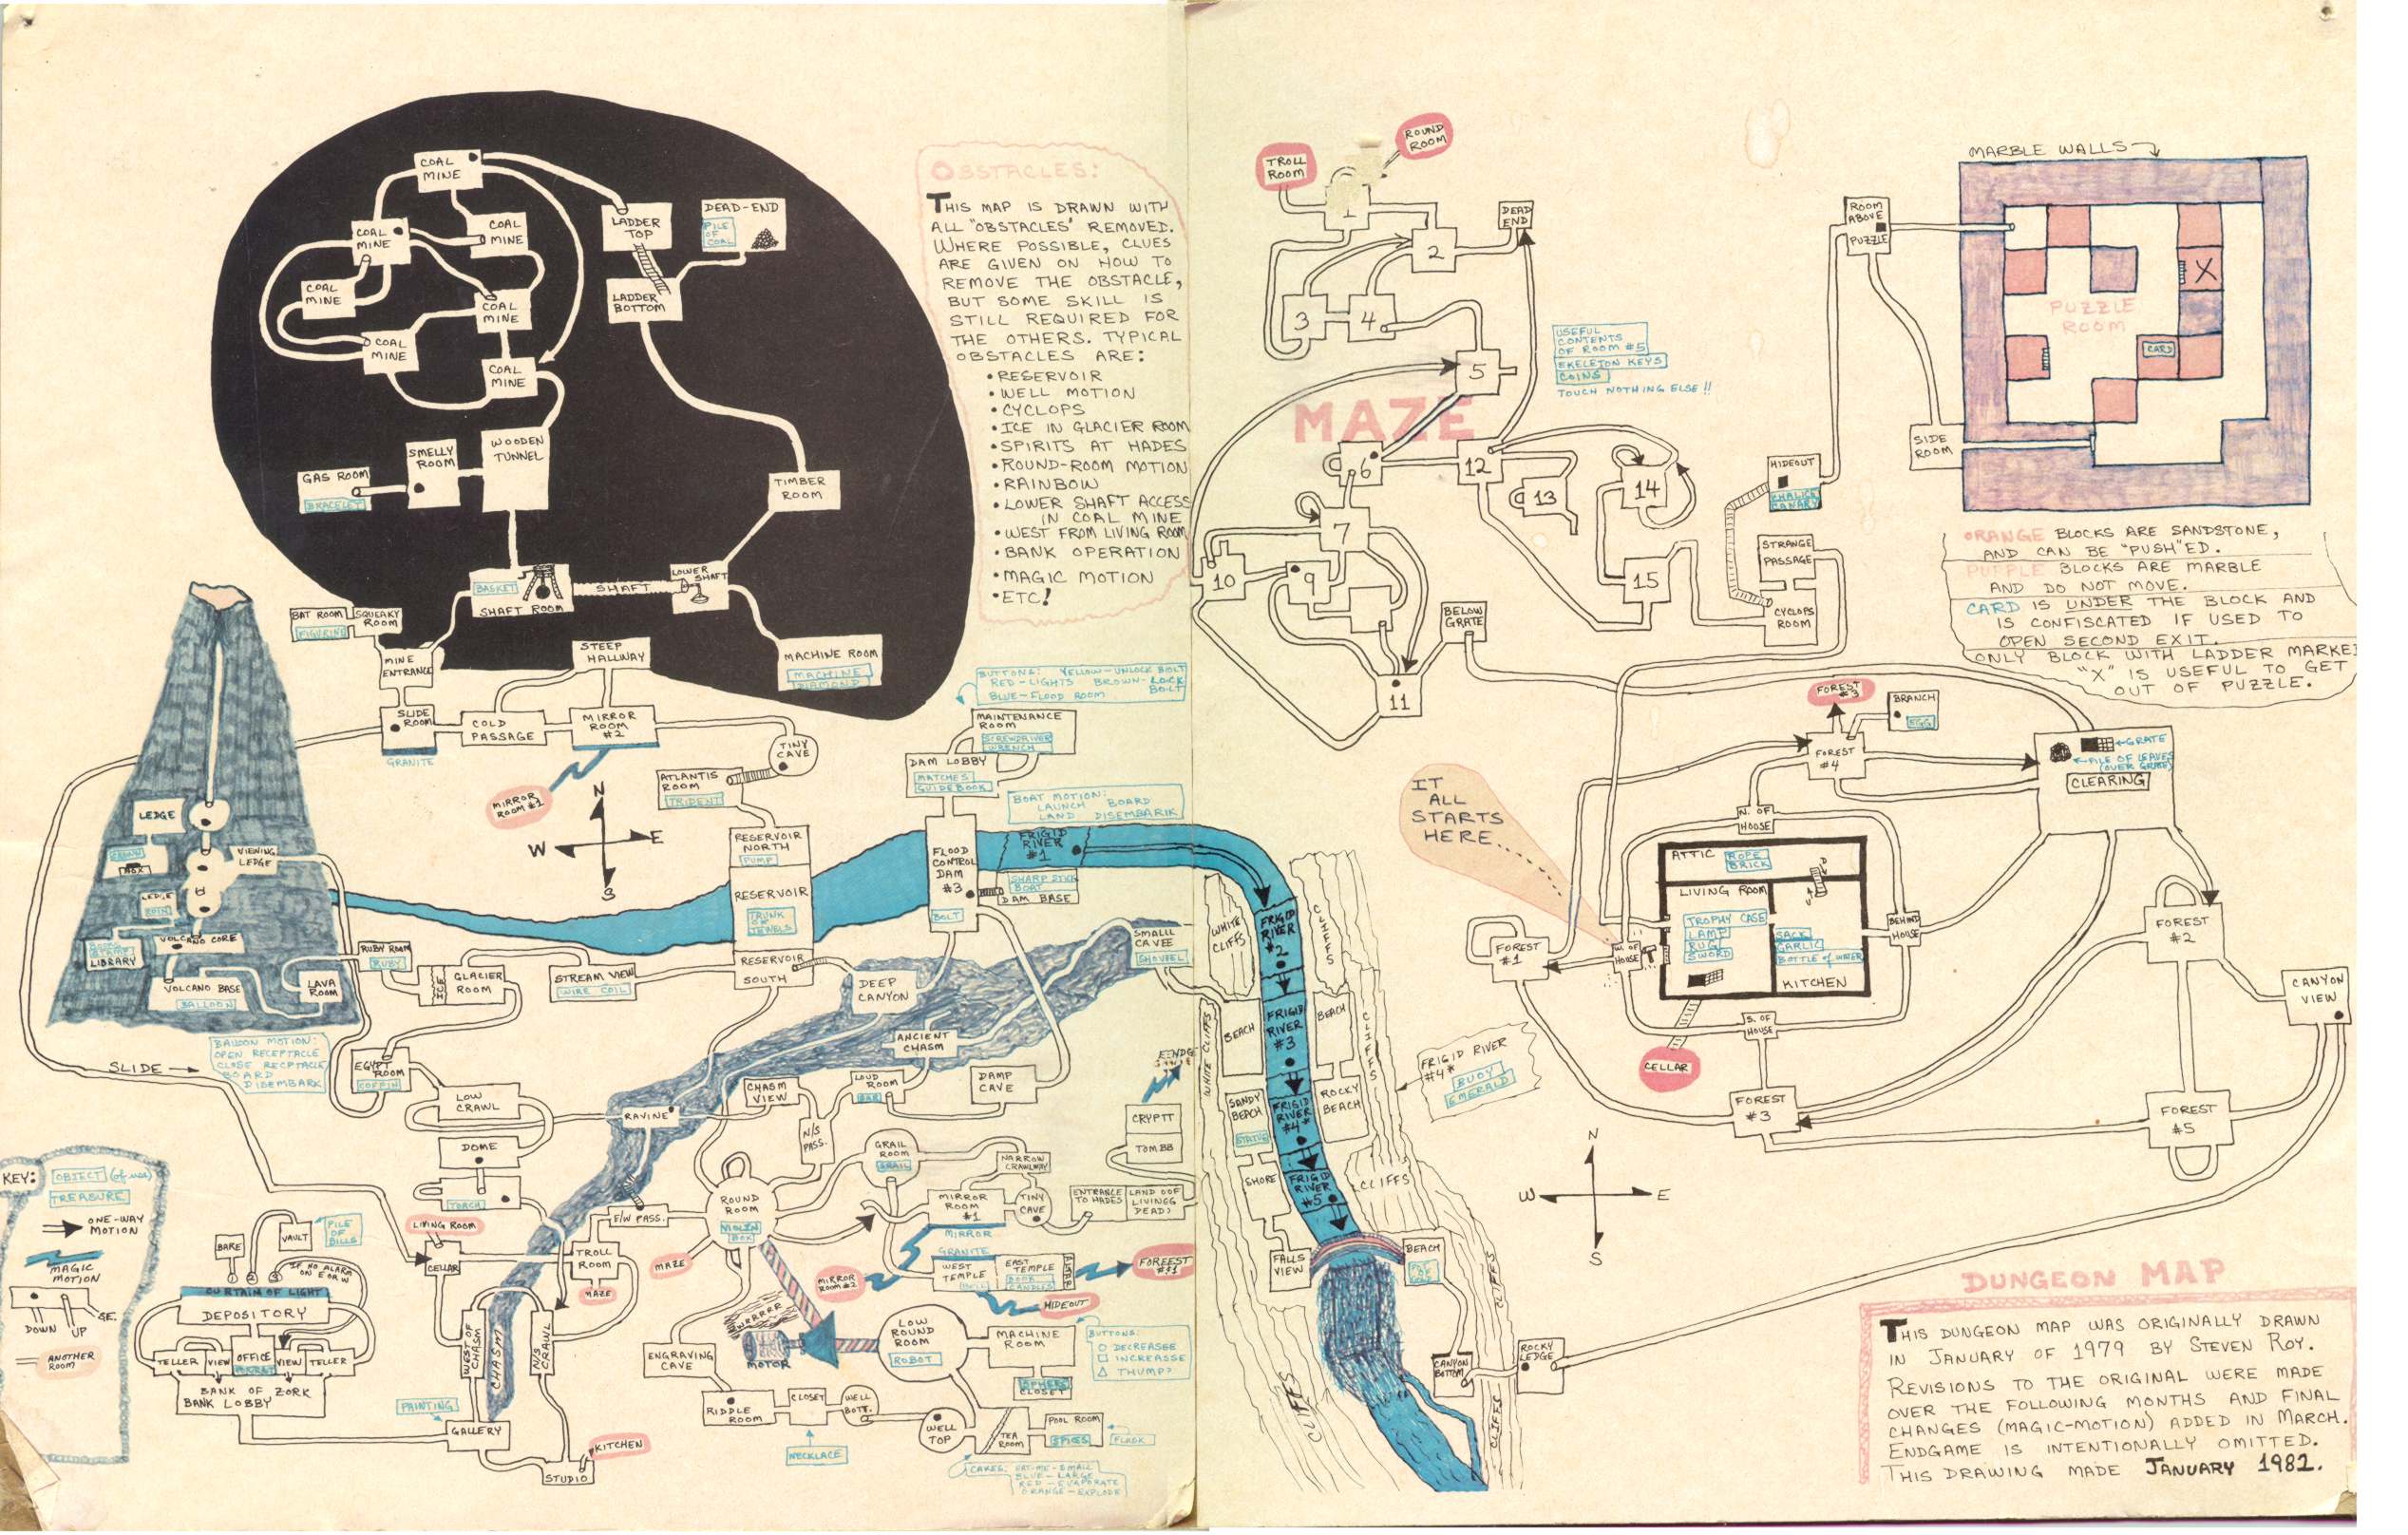
In case someone in the back didn’t hear it, this map is not from Dungeons and Dragons but from Zork/Dungeon. (via a surprising amount of people in a short period of time)
When reading about how low NYC’s greenhouse gas emissions are relative to the rest of the US, keep in mind the area surrounding NYC (kottke.org link). “Think of Manhattan as a place which outsources its pollution, simply because land there is so valuable.” (thx, bob)
NPR did a report on the Nickelback potential self-plagiarism. (thx, roman)
After posting about the web site for Miranda July’s new book, several people reminded me that Jeff Bridges’ site has a similar lo-fi, hand-drawn, narrative-driven feel.
In the wake of linking to the IMDB page for Back to the Future trivia, several people reminded me of the Back to the Future timeline, which I linked to back in December. A true Wikipedia gem.
I’m ashamed to say I’m still hooked on DesktopTD. The problem is that the creator of the game keeps updating the damn thing, adding new challenges just as you’ve finally convinced yourself that you’ve wrung all of the stimulation out of the game. As Robin notes, it’s a brilliant strategy, the continual incremental sequel. Version 1.21 introduced a 10K gold fun mode…you get 10,000 gold pieces at the beginning to build a maze. Try building one where you can send all 50 levels at the same time and not lose any lives. Fun, indeed.
Regarding the low wattage color palette, reader Jonathan notes that you should use that palette in conjunction with a print stylesheet that optimizes the colors for printing so that you’re not wasting a lot of ink on those dark background colors. He also sent along an OS X trick I’d never seen before: to invert the colors on your monitor, press ctrl-option-cmd-8. (thx, jonathan)
Dorothea Lange’s iconic Migrant Mother photograph was modified for publication…a thumb was removed from the lower right hand corner of the photo. Joerg Colberg wonders if that case could inform our opinions about more recent cases of photo alteration.
In reviewing all of this, the following seem related in an interesting way: Nickelback’s self-plagiarism, continual incremental sequels, digital photo alteration, Tarantino and Rodriquez’s Grindhouse, and the recent appropriation of SimpleBits’ logo by LogoMaid.
World map of where Wal-Mart gets its products. China dominates, Russia and most of Africa doesn’t exist, and Europe is tiny. (via fakeisthenewreal)
Detailed hand-drawn Dungeons and Dragons dungeon map. See also maps drawn from memory.
Update: The map is not from Dungeons and Dragons but from the “original mini-computer” version of Zork, then called Dungeon. (thx, everyone in the world)
A French map shows that the Portuguese were the first Europeans to discover Australia in the early 1520s, almost 250 years before Captain Cook claimed them for Britain. “‘The Vallard cartographer has put these individual charts together like a jigsaw puzzle. Without clear compass markings its possible to join the southern chart in two different ways. My theory is it had been wrongly joined.’ Using a computer Trickett rotated the southern part of the Vallard map 90 degrees to produce a map which accurately depicts Australia’s east coast.”
The must-see link for today is Social Explorer. Jump right to the maps section or to the New York City % White 1910-2000 and the the New York City % Black 1910-2000 slideshows. Running the shows forward, you can see blacks settling into Harlem, Brooklyn, and Queens and then spreading out from there. I wish it were slightly easier to make slideshows, but it’s still really fun to play around with all the maps. (via vsl)
Wikipedia has a series of maps showing the political and social boundries of the world in 2000 BC, 1000 BC, 500 BC, 323 BC and so on.
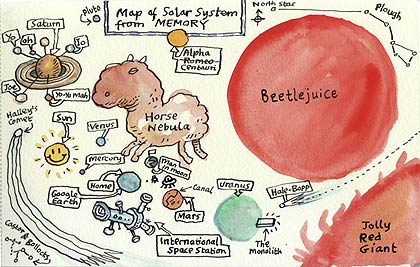
The first time I saw a world map drawn from memory was at Christopher Fahey’s apartment. I forget how long it took him to draw, but it was remarkably accurate and fairly large (a few feet across). Ever since then, I’ve kept an eye out for other hand-drawn maps (you know what they say: if you can’t do, collect). Via waxy this morning comes the From Memory Flickr group. My favorites from the group are this map of the male human body and a fanciful drawing of the solar system, both by Ellis Nadler:
Mapping.com has links to several maps from memory drawn by grade- and middle-school children; this world map by a 7th grade class is not too shabby. I’m struck by how much some of these world maps from memory resemble world maps drawn in the 16th and 17th centuries, like this Dutch map from 1689. All the parts are (mostly) there…it’s just that everything is a little wrong-sized and slightly skewed.
Lori Napoleon collects “personal maps” from various people. This tactical guide for nourishing yukio includes directions to the owner’s house, outlines of the two different keys (outside door, inside door), and what to feed the cat and when.
Also slightly related is the Fool’s World Map, a deliberately addled world map prompted by a question asked of the map-maker by a Texan: “How many hours does it take to go to Japan by car?”
Update: Despite having featured his work on kottke.org late last year, I completely forgot about Stephen Wiltshire’s super-realistic drawings from memory. Here’s video of Stephen drawing Tokyo from memory and Rome from memory. (thx, matt)
Update: Christopher Fahey uploaded a photo of his world map drawn from memory.
If Strangemaps wasn’t such a reliable source, I’d think this was a hoax. A small part of East Germany lives on in the Caribbean. Cuba gave the tiny island to the GDR in 1972 while on a state visit to East Berlin and it wasn’t mentioned in the German unification treaties. Commenters on the thread have found satellite images of the island in question, including this one.
Not sure when these features were added, but Google Maps now displays public transportation stops (NYC subway, the T in Boston, the L in Chicago) and building outlines for metropolitan areas. Here’s a shot of the West Village in NYC:
Tiny but useful improvements. (thx, meg)
World map of driving orientations. “An estimated 66% of people worldwide live in right-hand side countries, and 72% of all distances are completed while driving on the right side of the road.”
Dumb interface, but here are some neat maps of global fish catch locations, mostly tuna. For example, on these maps you can see the dramatic increase of purse seine fishing from 1964-1998. (thx, spencer)
Map of the Land of Oz. “Oz is completely surrounded by deserts, insulating the country from invasion and discovery. The isolation may be splendid, it is not total: children from our world got through, as well as the Wizard of Oz and the more sinister Nome King. To prevent further incursions, Glinda created a barrier of invisibility around Oz.”
Strange Maps post about the Vinland Map, a document proported to have been drawn in the 15th century from a 13th century map. The Vinland Map depicts an unknown land across the Atlantic Ocean called Vinland which some think is the part of North America visited by the Vikings in the 11th century.
A pair of trend maps for 2007, both based on subway maps. The top one depicts the top online companies/brands & how they’re connected while the bottom one deals with ideas (with the River of Consciousness standing in for the Thames).

Both maps were found in this article about internet predictions in 2007. I don’t know about you, but I find these types of maps fun to look at, but completely inscrutable informationally speaking. Surely there’s a more enlightening way to present this information than in Tube map form.
A tourist map of Gotham City. Gotham resembles “Manhattan below 14th Street at 11 minutes past midnight on the coldest night in November”.
A nearly continuous wire that encompasses 150 city blocks of Manhattan forms the “walls” of a symbolic Jewish household called an eruv.
The Orthodox and other observant Jews living within this ‘home’ are permitted certain actions outside their literal homes — pushing a stroller to the synagogue, carrying keys, walking a dog on a leash — that would otherwise be forbidden on the Sabbath.
Prewalking: walking down the subway platform so that when you board the train, you’ll be close to the exit or transfer point when the train reaches its destination.
Update: Photo of the Way Out -> tube map, which marks which side of the train to exit from and where exits/transfers are for each station. (thx, tom)
Update: Exit maps are available for the Toronto and Toyko subways. (thx, adam)
Test yourself: how well can you pick out countries on a map of the world? I got a 59 my first time through…better than I thought I would do. (via plasticbag)
Newer posts
Older posts
Socials & More