



Stamen delivers another lovely project: Trulia Hindsight. It’s an animated map of the US which shows new home construction over a period of years “with an eye towards exposing patterns of expansion and development”. As you might expect, the growth of a city like Las Vegas is interesting to watch. More on the project from Stamen and on the Trulia Hindsight blog.

Advertise here with Carbon Ads
This site is made possible by member support. 💞
Big thanks to Arcustech for hosting the site and offering amazing tech support.
When you buy through links on kottke.org, I may earn an affiliate commission. Thanks for supporting the site!
kottke.org. home of fine hypertext products since 1998.
Beloved by 86.47% of the web.
kottke.org posts about infoviz
Pie charts representing the flags of the world
Pie charts representing the flags of the world’s nations…the area of each color on the charts corresponds to the percentage of that color used in the respective flag. I’ll take this opportunity to again maintain that Rem Koolhaas’ barcode flag for the EU is, technically speaking, wicked awesome. (via colourlovers)
A “story map” distributed to guests of a wedding that shows the possible occupational, relational, and recreational relationships between guests to be used as a conversational cheat-sheet. Reminiscent of Mark Lombardi’s network maps. Better larger. (via gulfstream)
Obesity infographics for several countries, the percentage of population older than 15 with a body-mass index greater than 30. That USA man is really fat.
Alex Reisner’s cabinet of statistical wonders
While bumping around on the internet last night, I stumbled upon Alex Reisner’s site. Worth checking out are his US roadtrip photos and NYC adventures, which include an account and photographs of a man jumping from the Williamsburg Bridge.
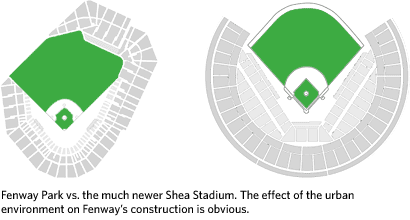
But the real gold here is Reisner’s research on baseball…a must-see for baseball and infographics nerds alike. Regarding the home run discussion on the post about Ken Griffey Jr. a few weeks ago, Reisner offers this graph of career home runs by age for a number of big-time sluggers. You can see the trajectory that Griffey was on before he turned 32/33 and how A-Rod, if he stays healthy, is poised to break any record set by Bonds. His article on Baseball Geography and Transportation details how low-cost cross-country travel made it possible for the Brooklyn Dodgers and New York Giants to move to California. The same article also riffs on how stadiums have changed from those that fit into urban environments (like Fenway Park) to more symmetric ballfields built in suburbs and other open areas accessible by car.
And then there’s the pennant race graphs for each year since 1900…you can compare the dominance of the 1927 Yankees with the 1998 Yankees. And if you’ve gotten through all that, prepare to spend several hours sifting through all sorts of MLB statistics, represented in a way you may not have seen before:
The goal here is not to duplicate excellent resources like Total Baseball or The Baseball Encyclopedia, but to take the same data and present it in a way that shows different relationships, yields new insights, and raises new questions. The focus is on putting single season stats in a historical context and identifying the truly outstanding player seasons, not just those with big raw numbers.
Reisner’s primary method of comparing players over different eras is the z-score, a measure of how a player compares to their contemporaries, (e.g. the fantastic seasons of Babe Ruth in 1920 and Barry Bonds in 2001):
In short, z-score is a measure of a player’s dominance in a given league and season. It allows us to compare players in different eras by quantifying how good they were compared to their competition. It it a useful measure but a relative one, and does not allow us to draw any absolute conclusions like “Babe Ruth was a better home run hitter than Barry Bonds.” All we can say is that Ruth was more dominant in his time.
I’m more of a basketball fan than of baseball, so I immediately thought of applying the same technique to NBA players, to shed some light on the perennial Jordan vs. Chamberlain vs. Oscar Robertson vs. whoever arguments. Until recently, the NBA hasn’t collected statistics as tenaciously as MLB has so the z-score technique is not as useful, but some work has been done in that area.
Anyway, great stuff all the way around.
Update: Reisner’s site seems to have gone offline since I wrote this. I hope the two aren’t related and that it appears again soon.
Update: It’s back up!
Summize is a product review site that uses sparkline-like color bars for ratings instead of stars. Here’s a bit more about how their display system works.
Ben Fry has updated his salary vs. performance graph for the 2007 MLB season…it plots team payrolls vs. winning percentage. The Mets and Red Sox should be winning and are…the Yankees, not so much. Cleveland and the Brewers are making good use of their relatively low payrolls.
Mystery graph
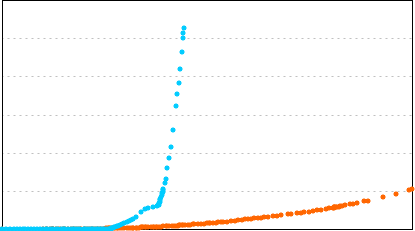
I’m working on a longish post for later today (or early tomorrow) about this graph:
More soon.
Update: The long post is done…the above graph is (roughly) the growth of Blogger (in orange) to the growth of Twitter (in blue).
Logical, linguistical, and infographical analysis of the #1 single on the Billboard chart, This Is Why I’m Hot by Mims. “Mims is hot because he’s fly. But it raises the question: Does being hot guarantee one’s being fly? […] It would appear that fly and hot are interchangable. If you are one, you are both; if you aren’t at least one, you are neither.” (via khoi)
Rollercoaster version of the graph of US home prices adjusted for inflation…you basically ride the curve of the graph. Brilliant…I want to ride all the graphs I come across! (via is it real or is it magnetbox)
Profile of Edward Tufte. “Running his own enterprise, Tufte says, allows him to work ‘elegantly, intensely, gracefully and incredibly efficiently.’”
Universe is another pretty but useless data visualization of the news. See also: just about every other data visualization of the news.
Neat music video by a band called The Longcut that uses infographics to tell the story of a boy and girl falling for each other.
Dumb interface, but here are some neat maps of global fish catch locations, mostly tuna. For example, on these maps you can see the dramatic increase of purse seine fishing from 1964-1998. (thx, spencer)
Social network map of the New Testament. Jesus Christ, supernode. (via waxy)
Diagram that charts instances of the “x is the new y” snowclone from 2005. See also: a list I compiled last last year.
Genealogy of Influence: “a graph of biographical entries at Wikipedia with connections denoting creative influence between philosophers, social scientists, writers, artists, scientists, mathematicians”. Reminds me peripherally of Simon Patterson’s The Great Bear (a print of which is hanging behind me right now).
Netlag: infovisualization of the world made of exterior web cams over time. So as the day goes on, you can see Europe light up, then the eastern seaboard of the US, then the western US, and so on.
Images of the dashed line in use (
Images of the dashed line in use (as hidden geometry, movement, paths, ephemeral material, etc.). “I’ve had trouble justifying my excitement about this intricate visual detail, so I thought it would be good to collect a bunch of examples from over fifty years of information design history, to show it as a powerful visual element in ubicomp situations.” (via migurski)
Five years since 9/11
Chart by Ben Schott (of Schott’s Original Miscellany) detailing the 5 years since 9/11.
How to do a click heatmap on your site with JavaScript and Ruby. Includes source code. Very slick.
Want to draw you some diagrams, charts, or flowcharts? Try these nifty tools.
Socials & More