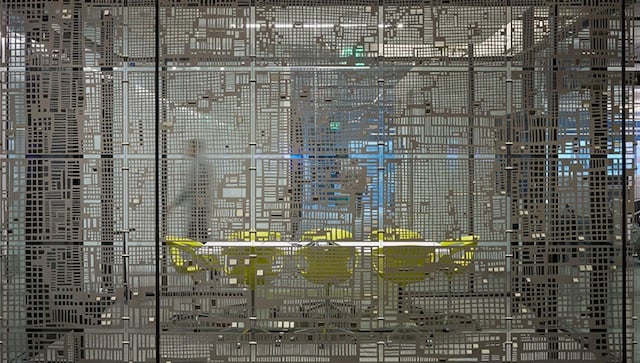
A thought-provoking post from Laurie Frick: “Will a Data-Selfie Boost Your Immune System?”
In the future I imagine human data portraits manifested from reams of personal tracking data gathered invisibly as we move thru the day. Genuine data-selfies. We are so close to gathering every possible morsel of data about us, imagine what could be possible once you owned every bit of data gathered about you. After some thought, I decided it’s more than just seeing personal data and abstract patterns of you. It’s about what these patterns will tell us about ourselves. Data collected about us will unfold a personal narrative and story to reveal a hidden part of us we are trained to ignore, a way to know ourselves and anticipate what comes next. Perhaps seeing the abstract patterns and rhythms of your self-tracking data is a short-cut to mindfulness. A quick and dirty way to boost your immune system, the benefits of meditation and self-reflection without much effort.
Frick makes art out of data. She also made an app called FRICKbits that empowers you to turn your data into art.
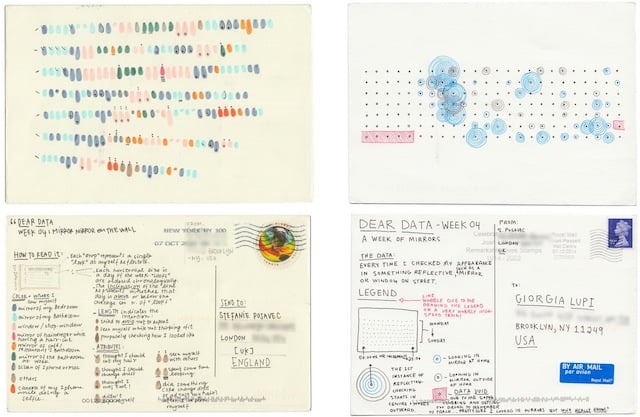
Giorgia Lupi, who lives in New York, and Stefanie Posavec, who lives in London, are engaged in a long-distance, postcard-based data exchange in order to get to know each other better: “Dear Data.” They’ve only met in person twice, and they’re both interested in data, so they’re sending each other postcard drawings of data about their day-to-day lives.
Each week we collect and measure a particular type of data about our lives, use this data to make a drawing on a postcard-sized sheet of paper, and then drop the postcard in an English “postbox” (Stefanie) or an American “mailbox” (Giorgia)!
Eventually, the postcard arrives at the other person’s address with all the scuff marks of its journey over the ocean: a type of “slow data” transmission.
By creating and sending the data visualizations using analogue instead of digital means, we are really just doing what artists have done for ages, which is sketch and try to capture the essence of the life happening around them. However, as we are sketching life in the modern digital age, life also includes everything that is counted, computed, and measured.
We are trying to capture the life unfolding around us, but instead we are capturing this life through sketching the hidden patterns found within our data.
The data appears on the front of the postcard, and a key explaining how to read the data appears on the back of the postcard. (via Coudal)
Color Code is a “color portrait of the English language”. It’s a treemap visualization created by assigning over 33,000 words its own color (colors are determined by averaging the colors of images found for each word on the web). If it’s running a little slow on your machine, check out the gallery for some neat examples. By Martin Wattenberg, creator of the grandaddy treemap app, Map of the Market.



Stay Connected