What’s the Labor Share of National Income?
While listening to an episode of Scene on Radio’s excellent series on Capitalism, I learned about an economic measure called the labor share of national income. From The Guardian:
This week, the Bureau of Labor Statistics released its latest estimate for the share labor receives of national income for the first quarter of 2024. The statistics shows the income workers receive compared with the productivity their labor generates.
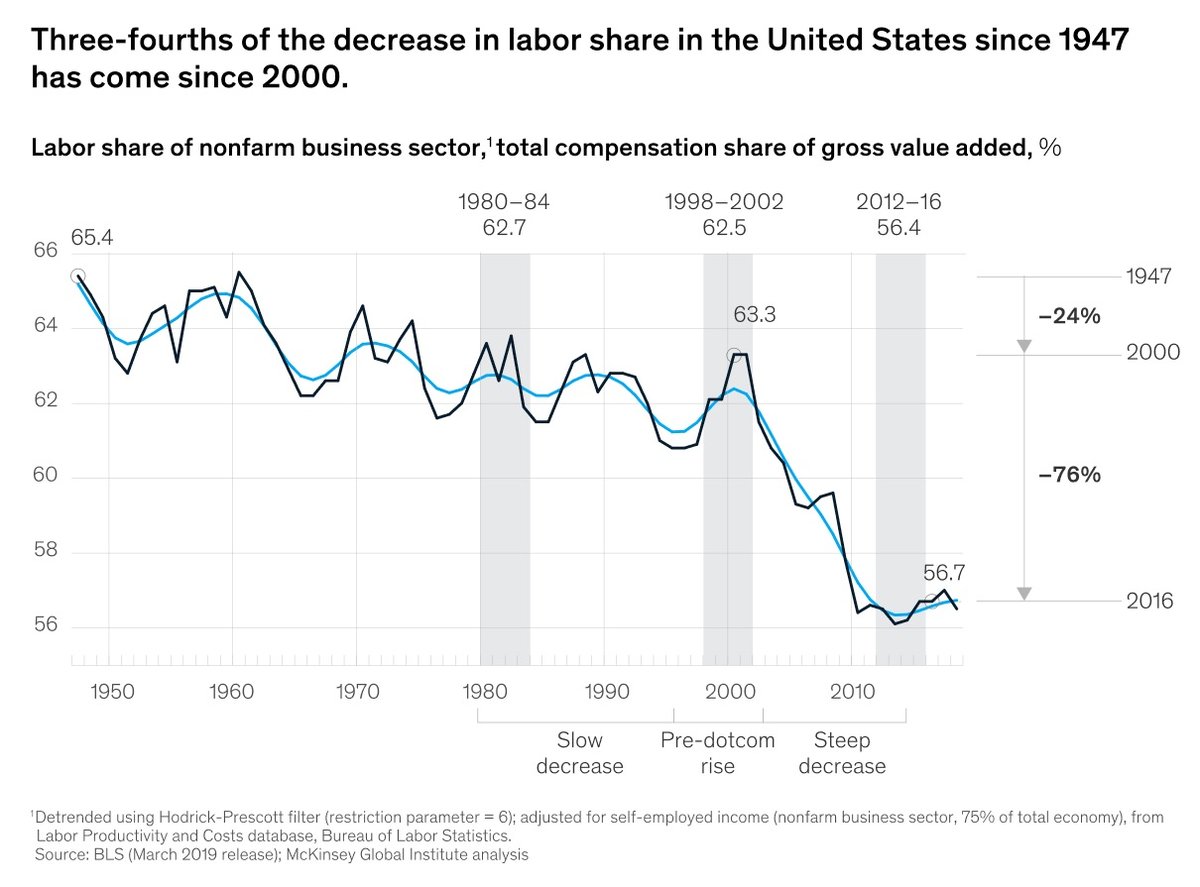
According to BLS, this income share has declined for non-farm workers from about two-thirds, 64.1% in the first quarter of 2001, to 55.8% in the first quarter of 2024.
Roughly speaking, in the first quarter of 2024, workers received ~56% of the income generated by their labor and 44% went to capital (ownership & shareholders).
Here’s a graph that shows the labor share of national income from 1947 to 2016 so you can get some idea of the decline that’s happened:

Scene on Radio hosts John Biewen and Ellen McGirt described labor share of national income like so:
Ellen McGirt: The labor share of national income. So, of all the income that businesses bring in, from sales of their goods and services, how much of that goes to workers. As opposed to, how much winds up as profits in the pockets of stockholders.
John Biewen: That number, according to the Federal Reserve, also went up significantly during the “thirty glorious years” in the United States. In the before times, in 1930, workers took home about 57% of the money that was generated by their labor. 57%. That labor share went up in the 1940s, to about 65% — almost two-thirds of corporate income was going to workers. It stayed over 60% for the next few decades, well into the 1970s.
Ellen McGirt: That doesn’t sound like a huge increase — from fifty-some percent to sixty-some percent. But the result, over those decades, was trillions of dollars in the pockets of people in the bottom 90-percent of the income scale — that’s money that would have gone to the wealthiest folks without those more progressive policies that reduced inequality. And then, guess what, starting in about 1975, the labor share of national income went down, and down. Until now, things are more like they were back in the days of Herbert Hoover.
This observation by McGirt is important but kind of hard to follow in text so I’ll restate it: when you’re talking about something as massive as the US economy, even a difference of a few percentage points in the labor share of national income over several years is trillions and trillions of dollars. And increasingly, those trillions are going to the wealthiest and not to the bottom 90%.
According to a groundbreaking new working paper by Carter C. Price and Kathryn Edwards of the RAND Corporation, had the more equitable income distributions of the three decades following World War II (1945 through 1974) merely held steady, the aggregate annual income of Americans earning below the 90th percentile would have been $2.5 trillion higher in the year 2018 alone. That is an amount equal to nearly 12 percent of GDP — enough to more than double median income — enough to pay every single working American in the bottom nine deciles an additional $1,144 a month. Every month. Every single year.
Price and Edwards calculate that the cumulative tab for our four-decade-long experiment in radical inequality had grown to over $47 trillion from 1975 through 2018. At a recent pace of about $2.5 trillion a year, that number we estimate crossed the $50 trillion mark by early 2020. That’s $50 trillion that would have gone into the paychecks of working Americans had inequality held constant — $50 trillion that would have built a far larger and more prosperous economy — $50 trillion that would have enabled the vast majority of Americans to enter this pandemic far more healthy, resilient, and financially secure.


Stay Connected