Visualization of Conservative America’s Vaccine Refusal
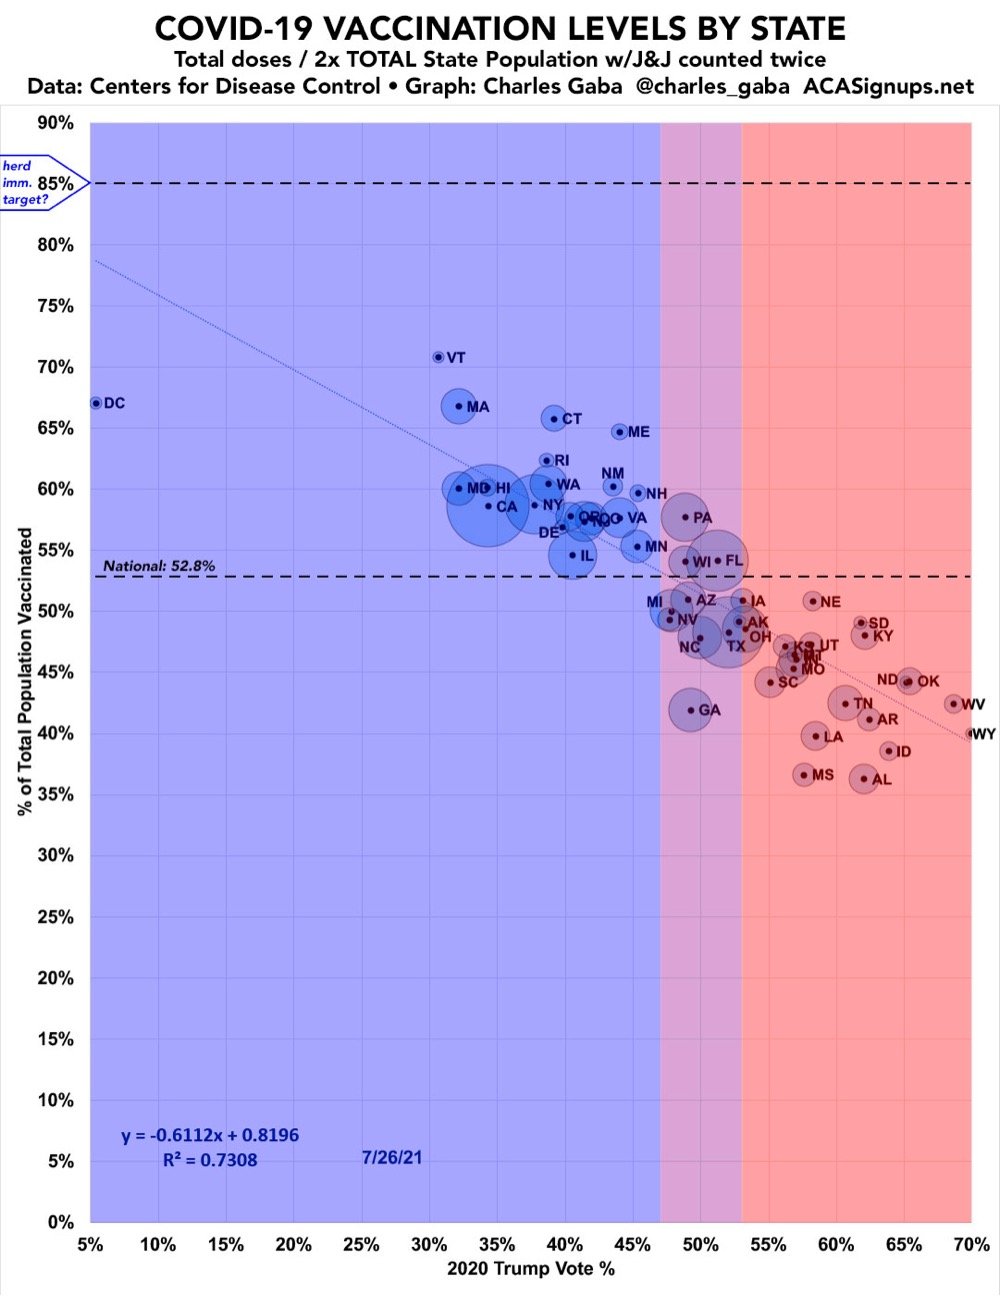
Charles Gaba has been graphing the Covid-19 vaccination rates of the 50 states (and DC) against the percentage of people who voted for Donald Trump in 2020 and there is unsurprisingly a clear correlation between the two:

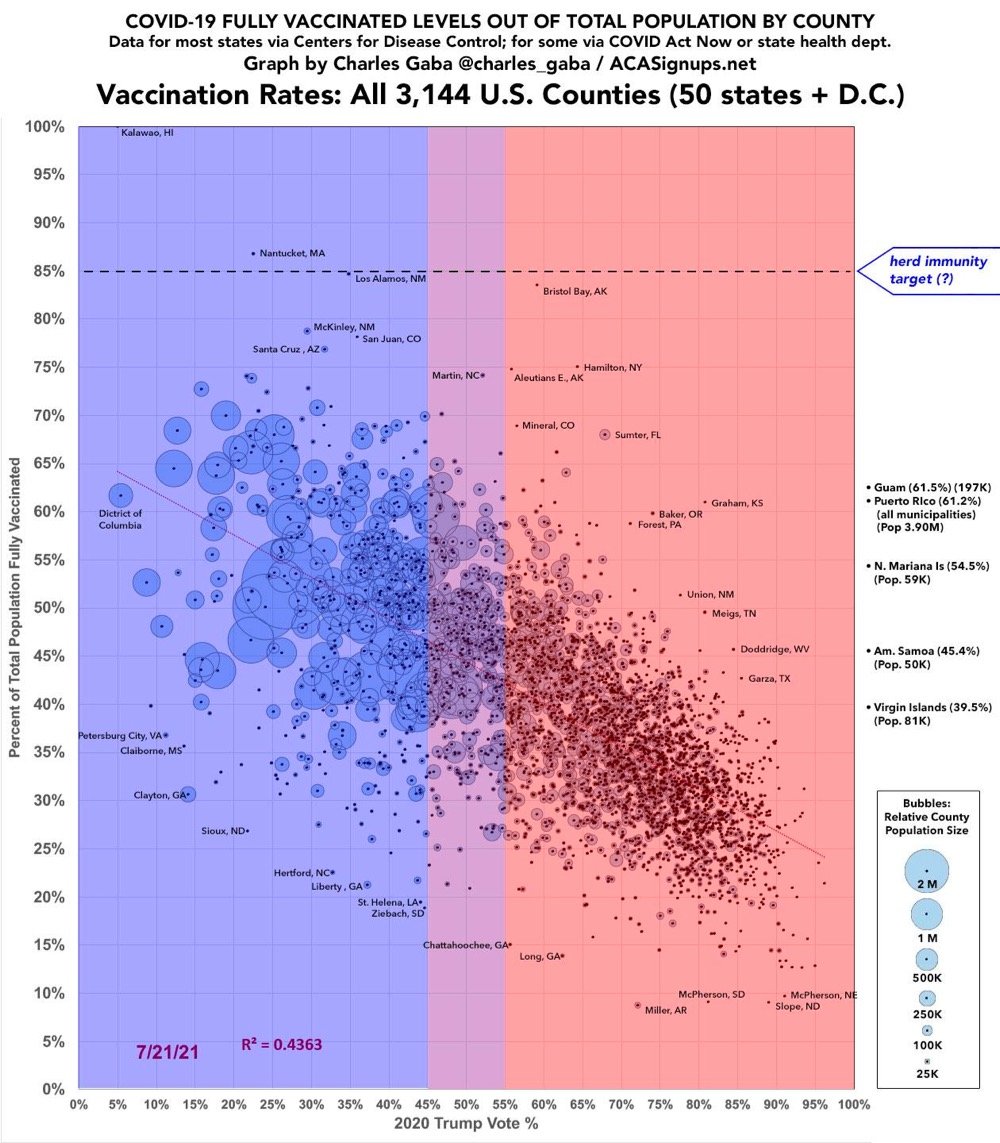
As one commenter noted, all of the solidly “blue” states are above the vaxxed national average and all the solidly “red” states are below it. The picture is a little more muddy when you look at the rates at the county level:

The “conservatives are unvaxxed” trend is still there, but a lack of access and education around the vaccines in counties with large Black and Latino populations also plays a large role in whether people are vaccinated or not.


Stay Connected