The Partisan States of America
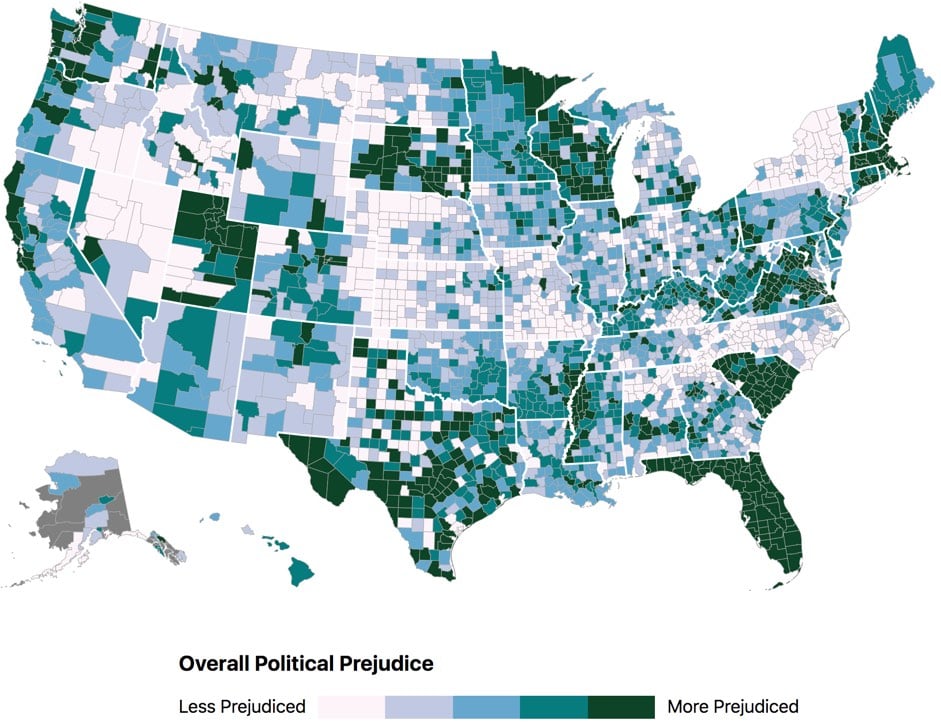
The Atlantic recently teamed up with polling and analytics company PredictWise to build a county-by-county map of political open-mindedness in America.

In general, the most politically intolerant Americans, according to the analysis, tend to be whiter, more highly educated, older, more urban, and more partisan themselves. This finding aligns in some ways with previous research by the University of Pennsylvania professor Diana Mutz, who has found that white, highly educated people are relatively isolated from political diversity. They don’t routinely talk with people who disagree with them; this isolation makes it easier for them to caricature their ideological opponents. (In fact, people who went to graduate school have the least amount of political disagreement in their lives, as Mutz describes in her book Hearing the Other Side.) By contrast, many nonwhite Americans routinely encounter political disagreement. They have more diverse social networks, politically speaking, and therefore tend to have more complicated views of the other side, whatever side that may be.
We see this dynamic in the heat map. In some parts of the country, including swaths of North Carolina and upstate New York, people still seem to give their fellow Americans the benefit of the doubt, even when they disagree. In other places, including much of Massachusetts and Florida, people appear to have far less tolerance for political difference. They may be quicker to assume the worst about their political counterparts, on average.
If you click through to the article, the interactive map will let you see how prejudiced your county is. There are also maps for Republican on Democratic prejudice and Democratic on Republican prejudice.
This map is a little bit bonkers…I can’t wrap my head around some of the results. Why are Florida and South Carolina so polarized while the states surrounding them are not? And look at New York…aside from NYC, there’s relatively little polarization right up against a very polarized New England and Pennsylvania. Utah sticks out among western states but you can probably chalk that up to Mormonism. Is this a methodology problem or is it due to something fundamentally different about the states and/or their governments?


Stay Connected