A Visualization of American Age Generations

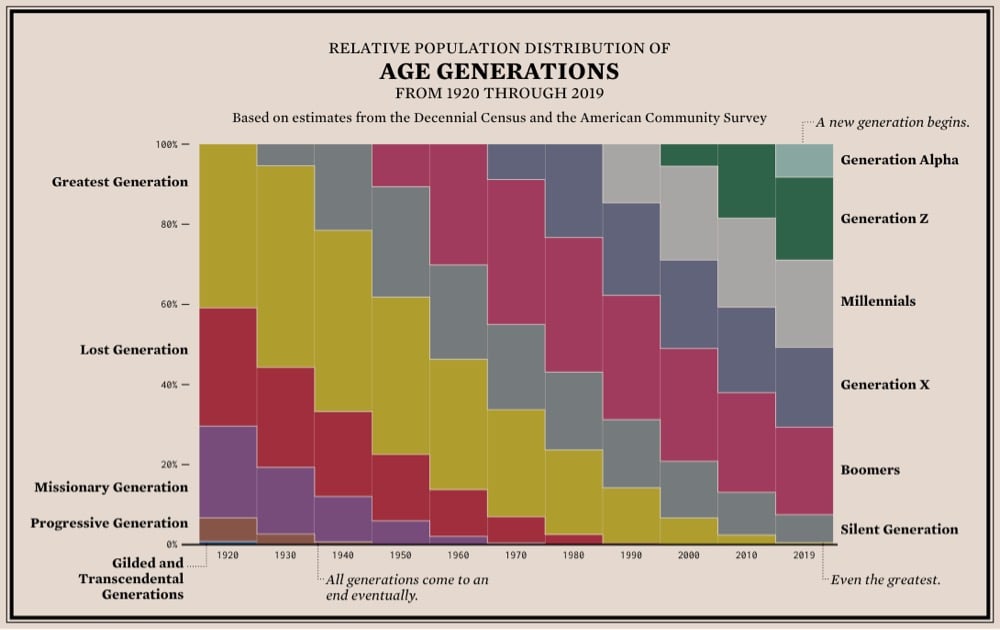
From Flowing Data, a stacked bar chart showing the relative population distribution of age generations from 1920 to the present. The thing that’s really apparent to me in this graph is how the size, increased life expectancy, and better quality of life of the Silent and (especially) Baby Boomer generations really shifted the social order in America. It’s a triple whammy: this large group of very healthy people stuck around so much longer than the previous generations that they were able to keep their wealth and political/corporate power instead of handing it off to the next generations. It’s a generational firewall — they didn’t leave any room for their children or grandchildren. Instead, Gen X and Millennials got branded as lazy/apathetic and financially careless. (via @mikey_two)


Stay Connected