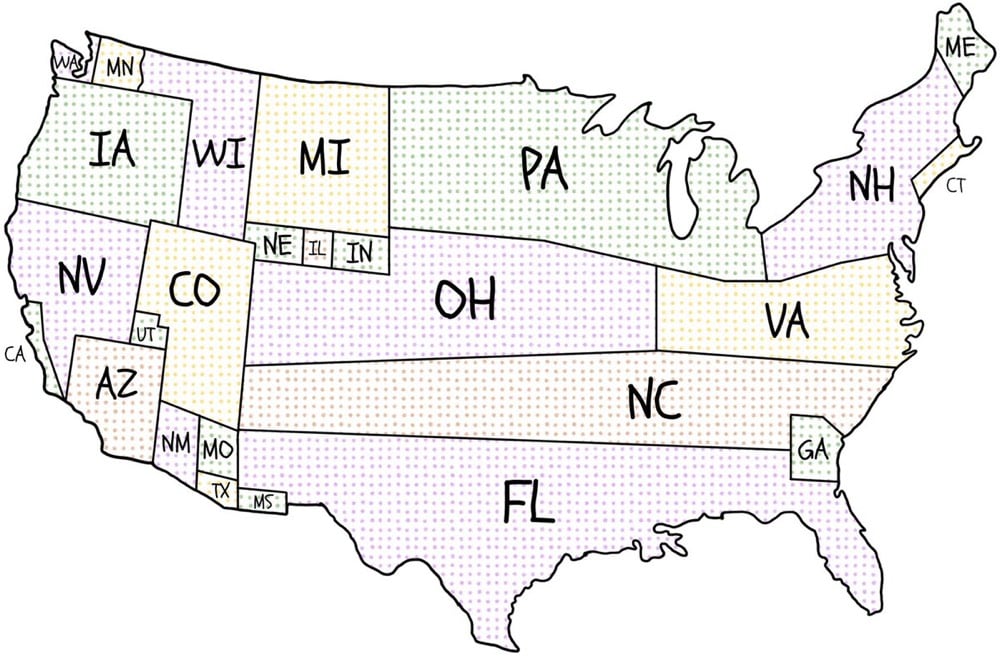
Distorted US Map of Where Candidates Campaigned in 2016
Because of the Electoral College and the way the primary system works in the US, presidential candidates end up spending a disproportionate amount of time is so-called “battleground states” like Pennsylvania, Ohio, and our dysfunctional friend Florida and primary states like Iowa and New Hampshire and less time where most of the US population actually lives (NY, CA, TX, IL, and in cities). The campaign for the National Popular Vote has produced a map that shows where the candidates did campaign events in 2016:

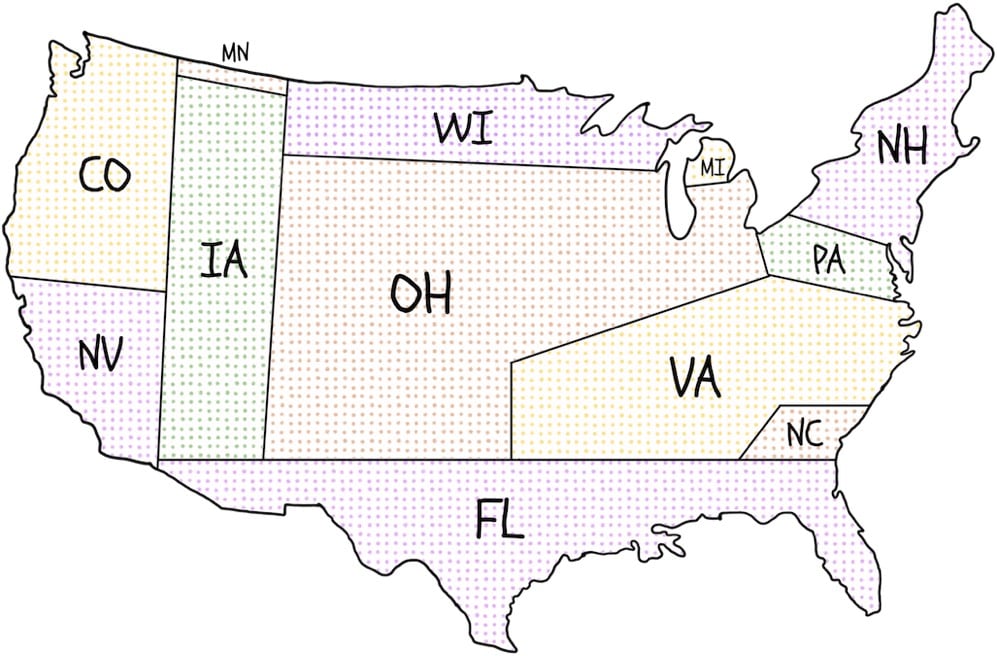
Because of these state winner-take-all statutes, presidential candidates have no reason to pay attention to the issues of concern to voters in states where the statewide outcome is a foregone conclusion. In 2012, as shown on the map, all of the 253 general-election campaign events were in just 12 states, and two-thirds were in just 4 states (Ohio, Florida, Virginia, and Iowa). Thirty-eight states were completely ignored.
And here’s the map for the 2012 election, which is even more extreme:

State winner-take-all statutes adversely affect governance. “Battleground” states receive 7% more federal grants than “spectator” states, twice as many presidential disaster declarations, more Superfund enforcement exemptions, and more No Child Left Behind law exemptions.
Also, because of state winner-take-all statutes, five of our 45 Presidents have come into office without having won the most popular votes nationwide. The 2000 and 2016 elections are the most recent examples of elections in which a second-place candidate won the White House. Near-misses are also common under the current state-by-state winner-take-all method of awarding electoral votes. A shift of 59,393 votes in Ohio in 2004 would have elected John Kerry despite President Bush’s nationwide lead of over 3,000,000 votes.


Stay Connected