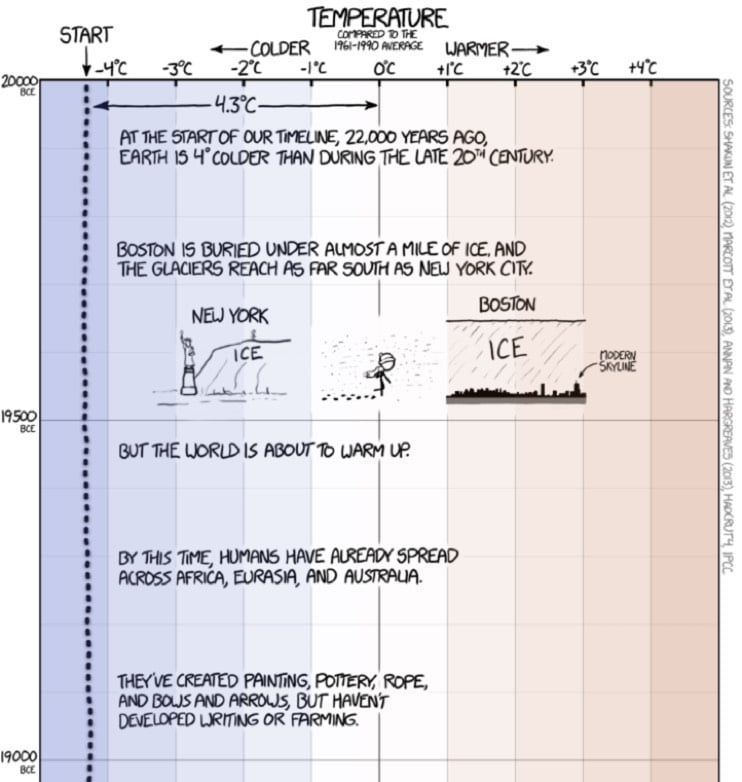
A timeline of the Earth’s average temperature

From XKCD, a typically fine illustration of climate change since the last ice age ~20,000 years ago.
When people say “the climate has changed before”, these are the kinds of changes they’re talking about.
And then in the alt text on the image:
[After setting your car on fire] Listen, your car’s temperature has changed before.
The chart is a perfect use of scale to illustrate a point about what the data actually shows. Tufte would be proud.
Update: Tufte is proud. (via @pixelcult)


Stay Connected