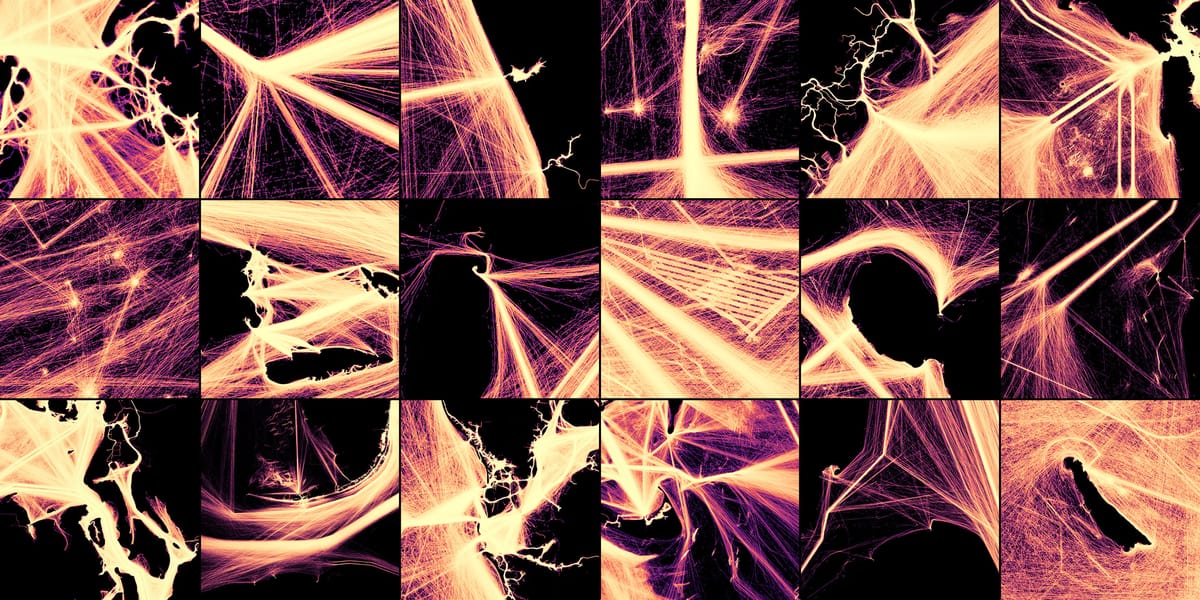
Visualizing Ship Movements with AIS Data. “Explore the beautiful, intricate paths of ships over a year — tracked from America’s busiest ports to the open ocean via AIS marine tracking data.”
Advertise here with Carbon Ads
This site is made possible by member support. 💞
Big thanks to Arcustech for hosting the site and offering amazing tech support.
When you buy through links on kottke.org, I may earn an affiliate commission. Thanks for supporting the site!
kottke.org. home of fine hypertext products since 1998.
Beloved by 86.47% of the web.
Comments 4
I adore these kinds of visualizations.
Ive been searching for large format imagery to hang over my bed. These are beautiful and I could see getting one printed very large.
See also Dan Coe's 4k lidar images of rivers.
These are vaguely reminiscent of this Kottke post from last year of LiDAR imagery
EDIT: Looks like Jason beat me to it :)
Hello! In order to comment or fave, you need to be a current kottke.org member. If you'd like to sign up for a membership to support the site and join the conversation, you can explore your options here.
Existing members can sign in here. If you're a former member, you can renew your membership.
Note: If you are a member and tried to log in, it didn't work, and now you're stuck in a neverending login loop of death, try disabling any ad blockers or extensions. Or try logging out and then back in. Still having trouble? Email me!
In order to comment or fave, you need to be a current kottke.org member. Check out your options for renewal.
If you feel like this comment goes against the grain of the community guidelines or is otherwise inappropriate, please let me know and I will take a look at it.
This thread is closed for new comments & replies. Thanks to everyone for participating!